Event stream manipulation using Rx – Part 2
In Part 1 of this post we became familiar with the Observer pattern, the Rx framework, and using marble diagrams to represent and think about sequences of events.
In this post we will use a few of these ideas to write some code and produce something. Let's get started!
An example scenario and requirements
Imagine that we have an existing application that writes log events to multiple Windows Event Logs.
It does this for a number of reasons. It takes advantage of the good performance of the Event Tracing for Windows facility, as well as the contextual data it captures for you.
It also provides flexibility in how to capture (e.g. the various sinks provided by Semantic Logging Application Block or SLAB) and process the data.
We could use SLAB and it's various inbuilt event sinks, to take this data and push it somewhere else.
For example we could use the Elasticsearch sink or Azure sink.
However, due to the nature of the data we getting from our existing application and how we want to shape it, we will write our own service.
In the "shaping the data" bit, we are aiming to achieve the following things:
- The application writes to more than one event channel (e.g. Operational and Admin). Merge multiple source log entries into a single stream for processing.
- The application isn't very smart in what it logs, often spamming logs with the same error repeatedly. Wrap up duplicate messages (e.g. instead of receiving 1000 duplicate errors in 1 second, keep 1 and record that it happened 1000 times).
- The servers the application runs on can get a bit overloaded which can mean performance problems. Listen to various appropriate performance counters.
- While we'd like to make the raw performance data available for graphing/monitoring, it would be useful if every log entry just came with a snapshot of a pertinent set of performance samples. Insert performance data into each log entry.
Note that this isn't intended to be a guide on how to use these technologies to their best potential given different scenarios, but as a concocted example to allow walking through a few key features.
Nor is it intended to provide a fully working solution to the problem, outside of the code snippets provided for discussion.
Getting entries into the Windows Event Log
To put log entries into the Event Log, the existing (fictional) application has an EventSource defined, which acts as an ETW provider.
If that doesn't make sense, don't worry – you can just carry on reading assuming the event log entries get created somehow.
For more information, see this previous post covering semantic logging using ETW and the EventSource package.
Using Tx to get the entries from the Event Log
Tx allows you to use LINQ and Rx on raw event sources. You can install the Tx package using NuGet – look for Tx.Windows or Tx.All.
Tx provides a number of handy factory methods, for generating Rx Observables. These can be from various sources such as the event log, performance counters, real-time trace sessions and historic trace data (.etl files).
To create each of these types of Observable, you would write something like the following:
The type of source being observed determines the type of data you get given.
We will be working with the first two in this article:
- When reading from an event log, you must provide the name of the event log. You are given an observable of EventRecord. This is in the System.Diagnostics.Eventing.Reader namespace and is what is received from an EventLogReader object, which is how EvtxObservable itself gets data from the event log (see the source for EvtxObservable).
- When reading performance counters, for real-time data, you must provide a sampling rate as a TimeSpan and an array of strings representing counter paths (in the format "\<counterSet>(<instance>)\<counterName>"). For historical data you can provide a file name. You are given an observable of PerformanceSample. This is defined in Tx.Windows and returns relevant perf counter information like counter set, name and value, instance, machine and timestamp.
- When reading directly from ETW, you must provide an array of etl file paths or a trace session name. You are given an observable of EtwNativeEvent. This is defined in Tx.Windows and represents an event (it is essentially a C# wrapper around an event in ETW's dedicated buffer – it is not a C# object on the heap or stack).
Using Rx to merge multiple input streams from the event log
Now that the scene has been set… let's get on to some of the most interesting bits – thinking about our event streams and writing code to do something with them.
Our first goal is to get events from a couple of event logs and merge the sequences into one.
The following code snippet demonstrates how that is achievable.
It is possible to perform the merge in one of two ways. The first way works for two sequences and is an extension method on an observable, taking the second observable as an argument.
The second way works for an arbitrary number of sequences and is an extension method on an enumerable of observables, requiring no arguments.
This merge can be visualised using a marble diagram like this (see the previous post if marble diagrams are new to you):

Using Tx to get performance counter data
Here we are setting up a real-time performance counter observable. It will take a sample every second, as defined by the TimeSpan argument, and it will sample the 3 counters specified.
So every second, there will be three new events in the stream.
Using Rx to compose performance samples with each log entry
We now have two observables that we want to combine in some way.
One giving us event log data and the other providing a set of performance counter data.
Perhaps the CombineLatest operator could be used for this purpose.
The definition of this is to merge two observable sequences into one observable sequence by using a selector function whenever one of the observable sequences produces an element. The marble diagram for that looks like this:
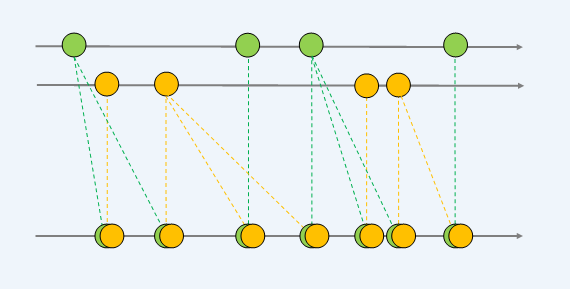
However this isn't quite right. Imagine that the top line (green circles) is our log data.
The first two elements in our result stream duplicates the first log entry twice. That isn't a useful behaviour for logs.
Ideally what we want, is instead of elements on either source sequence producing an element in the result sequence, only those elements on the log sequence do so.
You could think of the two streams as a "primary" stream, and a "secondary" stream.
The resulting stream produces a result on every element of the primary stream, giving you that element and whatever the last element from the secondary stream was.
All of that textual description can be distilled into this marble diagram:
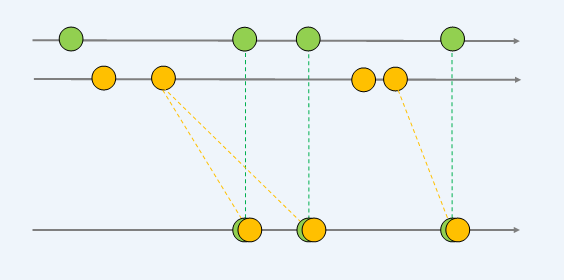
This is an extension method for an Observable that achieves the behaviour described above. I've called it ComposeLatest, because that seems descriptive of the way we are using it here.
It is essentially CombineLatest with some extra filtering behaviour to only perform the selector function for new elements in the primary sequence.
To make use of this extension method, we will create a new Event class.
This is simply a container for an EventRecord (which we are receiving from the event log observable) and a list of PerformanceSample (which we are receiving from the performance counter observable).
We'll need to perform a further projection on our event log observable, to transform the EventRecord into our new Event object.
We'll also need to buffer the performance samples. These are received one sample at a time, but we are really interested in the (latest) set of samples for a given timeframe.
Then we can use ComposeLatest for our two streams. The selector function takes an Event and a List<PerformanceSample> as input. It adds the list to PerformanceSamples property on the Event and returns the Event to the result sequence.
That whole process can be visualised in the following diagram.
You can see the buffering of performance samples, and the composition of the resulting list into each input event.

Using Rx to aggregate duplicate messages in a given rolling time window
Now we have a stream of events that contain a set of performance samples. However it's possible that a large number of these are duplicates (for example, our fictional application logs an error very frequently if it cannot connect to a remote server).
We aren't really interested in seeing a thousand of the same errors every second – all it does is hamper investigation of any larger issues.
So let's try and collapse duplicate messages into a single message, in a particular time window.
To do this some further data will be needed on an Event object.
Primarily, a count of the number of that specific event. We'll could also add the first and last time that event was seen within the time window, or any other information required.
Here is an AggregationData class (a new property of this type should be added to Event as well):
Each step in this blog has built upon the previous steps. Each step has only really been a single operation.
At this stage I am going to condense all of it into much terser form (chaining the observable method calls), in a console based application. We'll also define an observer class and subscribe to our final observable using that observer.
In the "Main" method below, you can see we are creating two observables, exactly as before.
One is taking a specific set real-time performance counters and buffering those samples into one second chunks. The other is merging two event log streams, projecting the result into our own richer type, combining the events with performance samples, then buffering into two second chunks.
The reason the second observable is buffered is so that we have a list of log events to work with. This will enable running through the list and only returning a distinct set of log events, grouped on the log message (with some data about that aggregation applied to each event).
It does mean the logs are delayed by a couple of seconds so are not being received exactly real-time, but for our purposes, this is good enough.
We subscribe to the final observable, passing in our observer object. When "on next" is called on the observer, the events are aggregated.
This is a LINQ query that groups by the log message, then for each group selects only the first element, saving the total number in that group plus some other details.
In this code, all that then happens is the log message is written out in the console.
In reality, we could go on to do something useful with it now that it is processed how we want. For example, push real-time to a monitoring dashboard using SignalR, or saving for text-based searching using tools like Splunk, Elasticsearch, or Azure Monitor.
A further exercise might be to turn the aggregation step into another custom observable extension method and applying it to the same chain of calls before subscribing.
This aggregation can be visualised with the following marble diagram. The lists of events in the result stream are annotated with the AggregationData. Count value, to make it clear what is going on:

Summing up
For a bit more marble diagram fun, let's combine the diagrams above into a single diagram representing the entire observable operation:
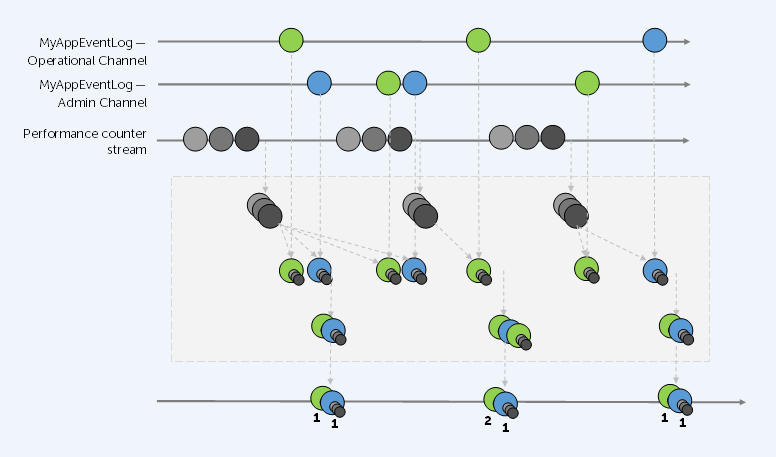
I'll leave it as an exercise for the reader to understand this diagram, tying the stages of the diagram back to all the steps previously discussed in this article.
This post demonstrated some more complex usage of Rx, in a contrived example, and visualised all the interactions using marble diagrams.
Hopefully it has been an interesting and useful read!

