Optimising C# for a serverless environment

I have previously written a blog on increasing performance via low memory allocation. The techniques I mentioned there were ones that we used in a recent project where we used Azure Functions to process marine vessel telemetry for around the world.
I now want to focus on what it means to optimize for this environment and give some more concrete examples of some of the techniques I mentioned in my previous blog.
Important to mention is the scale of the processing we were doing. We were processing messages from 200,000 vessels, all of whom checked in every 2 minutes. This is a huge number of events so any small optimization in the processing could have a huge impact on the performance of the system as a whole.
Serverless constraints
For our solution, we used Azure Functions to build up the processing. We chose to build the solution in this way in order to take advantage of the cheap compute provided by the offering. When using Azure Functions under the consumption plan you pay only for the compute you use. This means that by optimizing specifically for this environment you can build up incredibly cheap processing solutions.
There are a few constraints imposed when working in this serverless environment. The first is that there are limits on the amount of memory you can use when running under the consumption plan. This memory limit is 1.5GB when running the functions in Azure. When processing vast quantities of data this is something which you have to keep in mind when designing your process.
Alongside this, Azure functions pricing is based on both the execution time and the memory used during that time. This means that by improving the performance and by reducing the amount of memory, you will also reduce the cost of running the solution.
Benchmarking
We needed to be able to make sure that any changes we made to the solution were improvements in performance and/or cost. We also wanted to able to build these checks into the change management within our solution so that we could run these tests as part of our build process. To achieve this, we built a small tool that used application insights to monitor the running of the processing in Azure. We could then use this to assess any changes that we made.
With this in place, we could then start to optimize the solution...
Optimisation
In order to perform this optimisation, we needed to understand what factors affect performance in .NET. (We used .NET throughout our processing, but with Azure Functions you also have the option of using JavaScript, Python, Java, etc. and the principles around environment optimisation and benchmarking apply in any language.)
The first factor which affects performance is obviously the processing logic. If the code is doing a load of unnecessary work, then it will clearly take longer than it needs to.
But something that people often overlook is the effect of garbage collection. Garbage collection is the process in .NET of clearing up memory that is no longer needed. If you want to know more about how garbage collection works, this blog goes into more detail. But essentially what happens is it suspends processing in order to work out which references are still in use. This means that the more garbage collections that are triggered, the less time is spent on the actual processing. So, we clearly needed to reduce the amount of garbage collections triggered, which means that we needed to reduce the number of allocations caused by our processing.
In order to stay within the constraints imposed by functions and to also increase performance by reducing garbage collections we used several techniques. I ran through these in my previous blog but here I would like to provide more concrete examples of each case.
List pre-allocation
Lists in C# are built on top of arrays, and arrays need to be provided with a size upon initialisation. Lists provide an abstraction on top of this which means that you can just continually add objects, but under the covers these objects are stored in an array of a fixed size. When you exceed the size of the underlying array it is discarded and the objects are copied into a new array of double the size.

When you create a new list, if you don't specify a capacity, the array defaults to a size of 4. When you exceed the allocated size by adding 4 more numbers, it a new array is then allocated of size 8.
This continues as we add more items to the list. This not only gives the garbage collector a lot more work, but it becomes especially problematic when the lists get large. When we exceed the capacity of a large list, we then suddenly allocate a list of double that (already large) size. These sudden spikes in memory can easily (and did in our case) cause you to exceed the memory limits imposed by functions.
(Not only this, but as these large lists will be stored on the large objects heap, they can hang around for a long time after they are no longer in use – but I won't go into that here.)
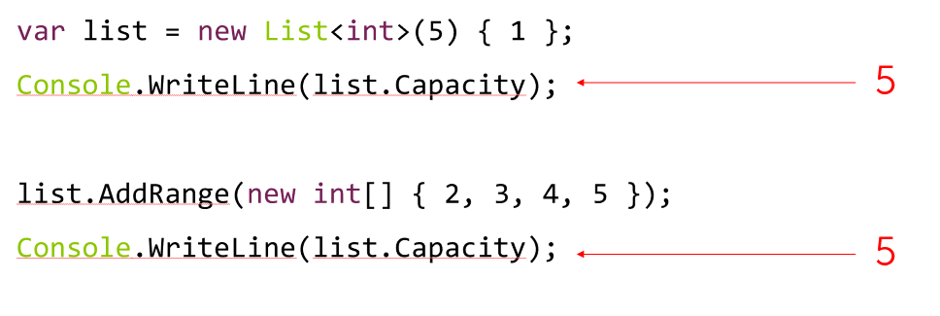
The way to get around this is to pre-allocate a list of the necessary size. We do this by specifying the capacity of the list when it is initialised. This avoids the problem of exceeding the capacity, and therefore of unnecessary memory spikes and usage.
IEnumerable<T> and stream processing
The next technique we used was to actually not use a list at all!
Instead we stored all of our data in an IEnumerable and aggregated the processing as we went. This only worked because we didn't need to do any whole-list operations. The processing we needed to do meant that we could process each vessel point in series and at no pointed needed to store the whole list in memory.
This greatly reduced the total memory used at any given time and therefore made it much less likely that we were going to hit the 1.5GB memory limit.
Value .vs. Reference types
Another thing to consider when trying to reduce memory is the arguments between reference and value types. This was one of the cases where benchmarking was extremely important. When I was first trying to reduce the memory used by the application I thought "well structs are smaller than classes so I'll switch to using those!" The issue was that because we were comparing pairs of vessel tracks we had many copies of the same objects, so I actually ended up making things much much worse…
Say we had an object of type Thing:
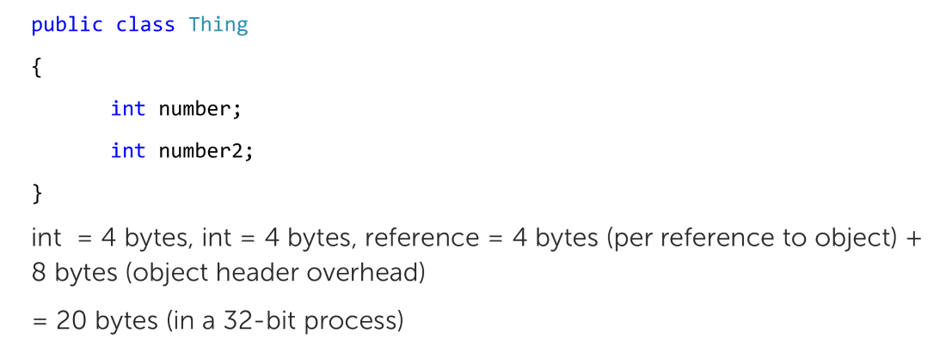
Using reference types, in a 32-bit process, a single Thing object will take up 20 bytes of memory. This includes the data (which is allocated on the heap), the pointer for the reference, and the memory used by the headers for an object on the heap.
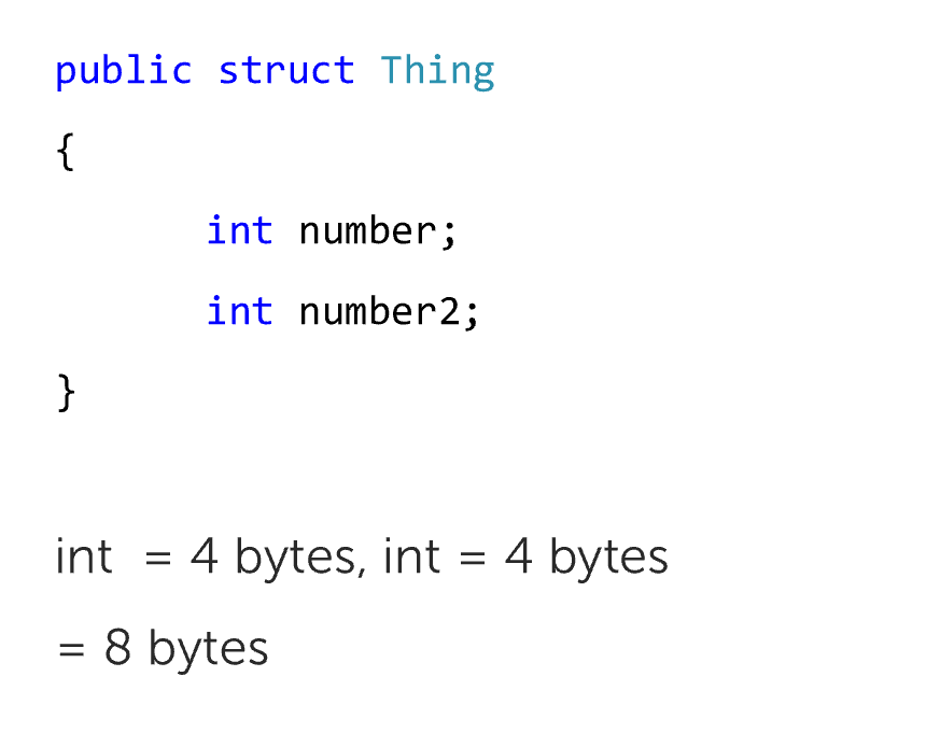
Whereas if Thing was instead a struct (which is a value type) you don't get the overhead and the object instead just takes up the memory needed by the data.
However, each extra copy of the reference object will just need to store an extra pointer to the same bit of memory on the heap. Each copy of a value type object will store a copy of the data in its own memory.
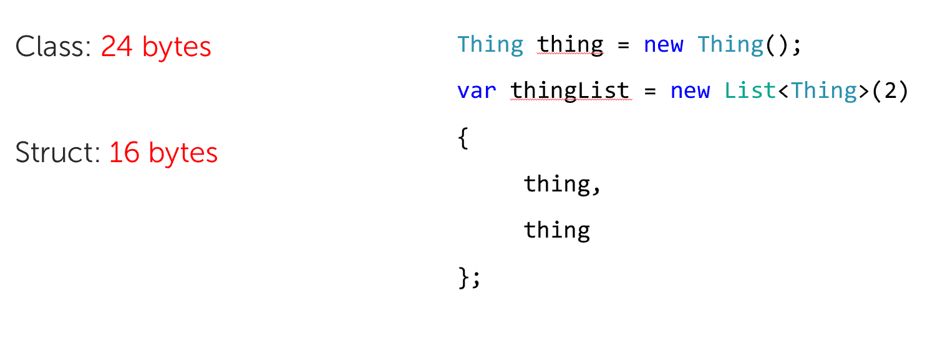
So, in our example, two copies of the class would take up 24 bytes (8 for the array 16 on the heap) and in the struct case it would take up 16 for the array.
If we have enough copies of the same object then eventually using structs rather than classes will actually use more memory.
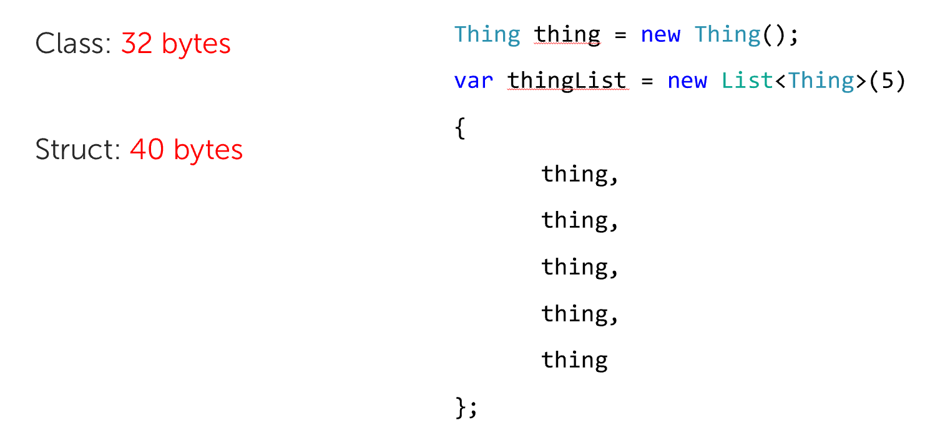
In the case where the data is 8 bytes then we would need 5 copies for this to be the case, however this effect gets more extreme as the objects get larger.
Span<T>
The final method we used to reduce allocations centres around a relatively new feature of C#, Span<T>. Spans are a way of indexing into different regions of continuous memory without causing any extra allocations.
Here's an example that I've stolen from Ian's new book on C# 8 (Which you should definitely read if you haven't already!).

If we have a string which represents a URI and initialise a new URI object, we can then access different parts of the address via properties on the URI. However, each of these properties is an additional string which has been allocated on the heap.

If we instead use a Span to access the first 4 characters of the memory, we can index directly into that memory. As spans are reference structs, which are allocated on the stack, we can do this without causing any extra allocations.
If you want to see this technique in action, have a look at our open source AIS parser which we created as part of the project – AIS.NET!
This style of processing obviously comes with its own complexities but saving on allocations when working in a serverless environment, especially in the case of big data, can be integral to efficient andcost-effective processing.
The outcome
After we had applied these optimisations, we found that we could run the analysis well within the limits imposed by Azure Functions. Not only this, but we found (using our benchmarking tool) that we would be able to do all the necessary processing for less than £10 / month!
The main take-aways here are:
In big data processing tiny optimisation can have a huge impact.
And that, after optimising for the cost profile and constraints of your environment, you can use the incredibly cheap compute provided by Azure Functions to do incredibly powerful (and large scale) data processing without breaking the piggy bank.


