Filtering unrelated tables in Power BI


The star schema is the preferred data modelling approach to use in Power BI, as it provides the best performance and flexibility for analytics. In the star schema, every dimension table has a direct relationship to a fact table, allowing the fact table to be filtered by the many dimensions.
But what happens when we want to filter one dimension by another dimension?
In this post, we explore a solution for enabling dimension tables to filter one another.
The Setup
We will be working with the following model containing one fact table, Sales, and two dimension tables, Product and Store. The Product and Stores tables each have a one-to-many relationship to the Sales table.

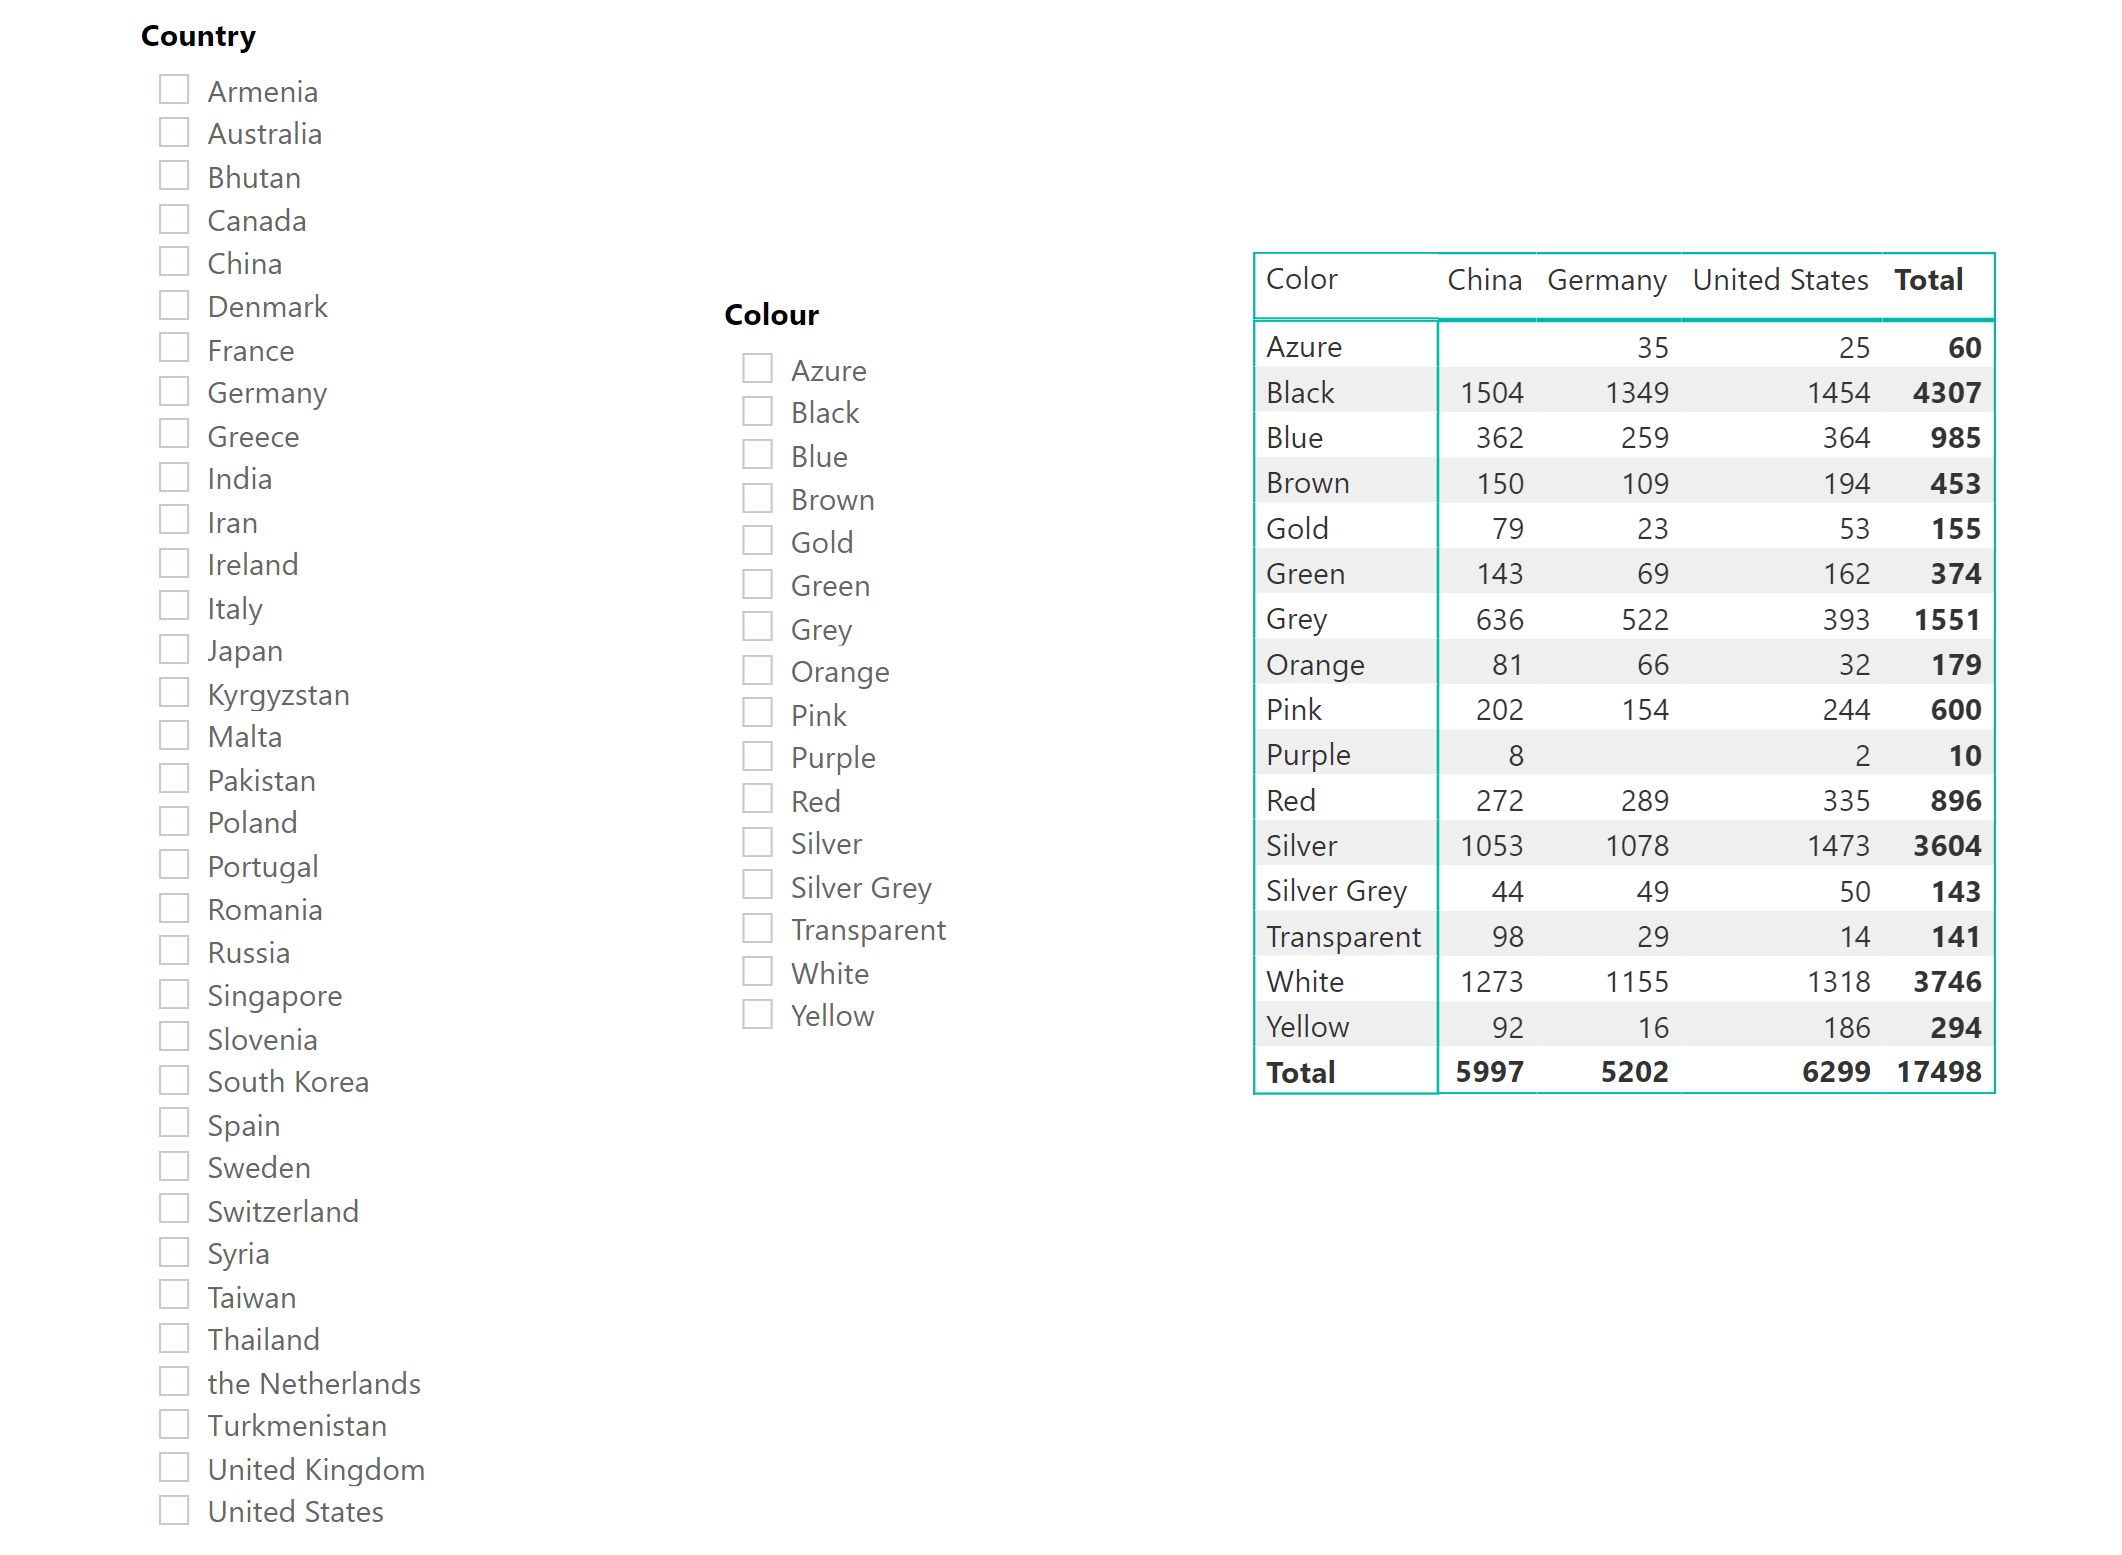
Our Power BI report contains a page with a matrix visual showing the quantity of sales by colour and country. The colour comes from a column in the Product table, and the countries come from a column in the Store table.
The report also contains two slicers, one for State and one for Colour.
Having both the two filters and the matrix visual would be redundant in a real report, but this will help us illustrate how the solution works.
The Problem
There are two behaviours of the current report that we are aiming to improve.
Looking at the matrix visual, note that data on the sales is available for three countries only, yet the slicer shows many more values. In a real report, this could lead users to waste time filtering by countries for which there is no data. Ideally, we would like the slicer to only show values for which there is data to show.
Again looking at the matrix visual, we can see that China has no record of sales for items in the colour azure. Selecting China in the Country slicer, we would like the slicer for Colour to update and only show colours for which sales were made in that country. This doesn't happen now, as Azure is still displayed in the Colour slicer when China is selected.
The Solution
The data model doesn't allow this filtering to happen, as the Product and Store tables are not related to each other. Their only link is the Sales table, to which both have one-to-many relationships.
We will use a measure to count the rows on the Sales table, thus allowing Power BI to know how to filter the other tables. The idea is that we want the Product and Store tables to be filtered by the rows that, used as a filter on the Sales table, would result in one or more rows left in the Sales table.
Taking the Country slicer as an example: the measure will iterate through each row in the Store table. For each row, it will count the number of rows left in Sales when being filtered by that one row in Store. We only want to display values when the Sales table has rows for it, and filter out any rows that return an empty Sales table. So the measure will identify which rows in the Store table are valid.
There are only two steps to complete to enable the filtering.
Step 1: Create the DAX measure
The measure is the following:
Is Valid Sales =
var SalesCount = COUNTROWS(Sales)
Return
IF(ISBLANK(SalesCount), 0, 1)
The measure counts the rows in the Sales table. If the count of rows is greater than 0, the measure returns 1. If the count of rows is equal to 0, the measure returns 0.
Step 2: Use the measure as a filter on the slicers
Now use this measure as a filter on the slicers for State and Colour.
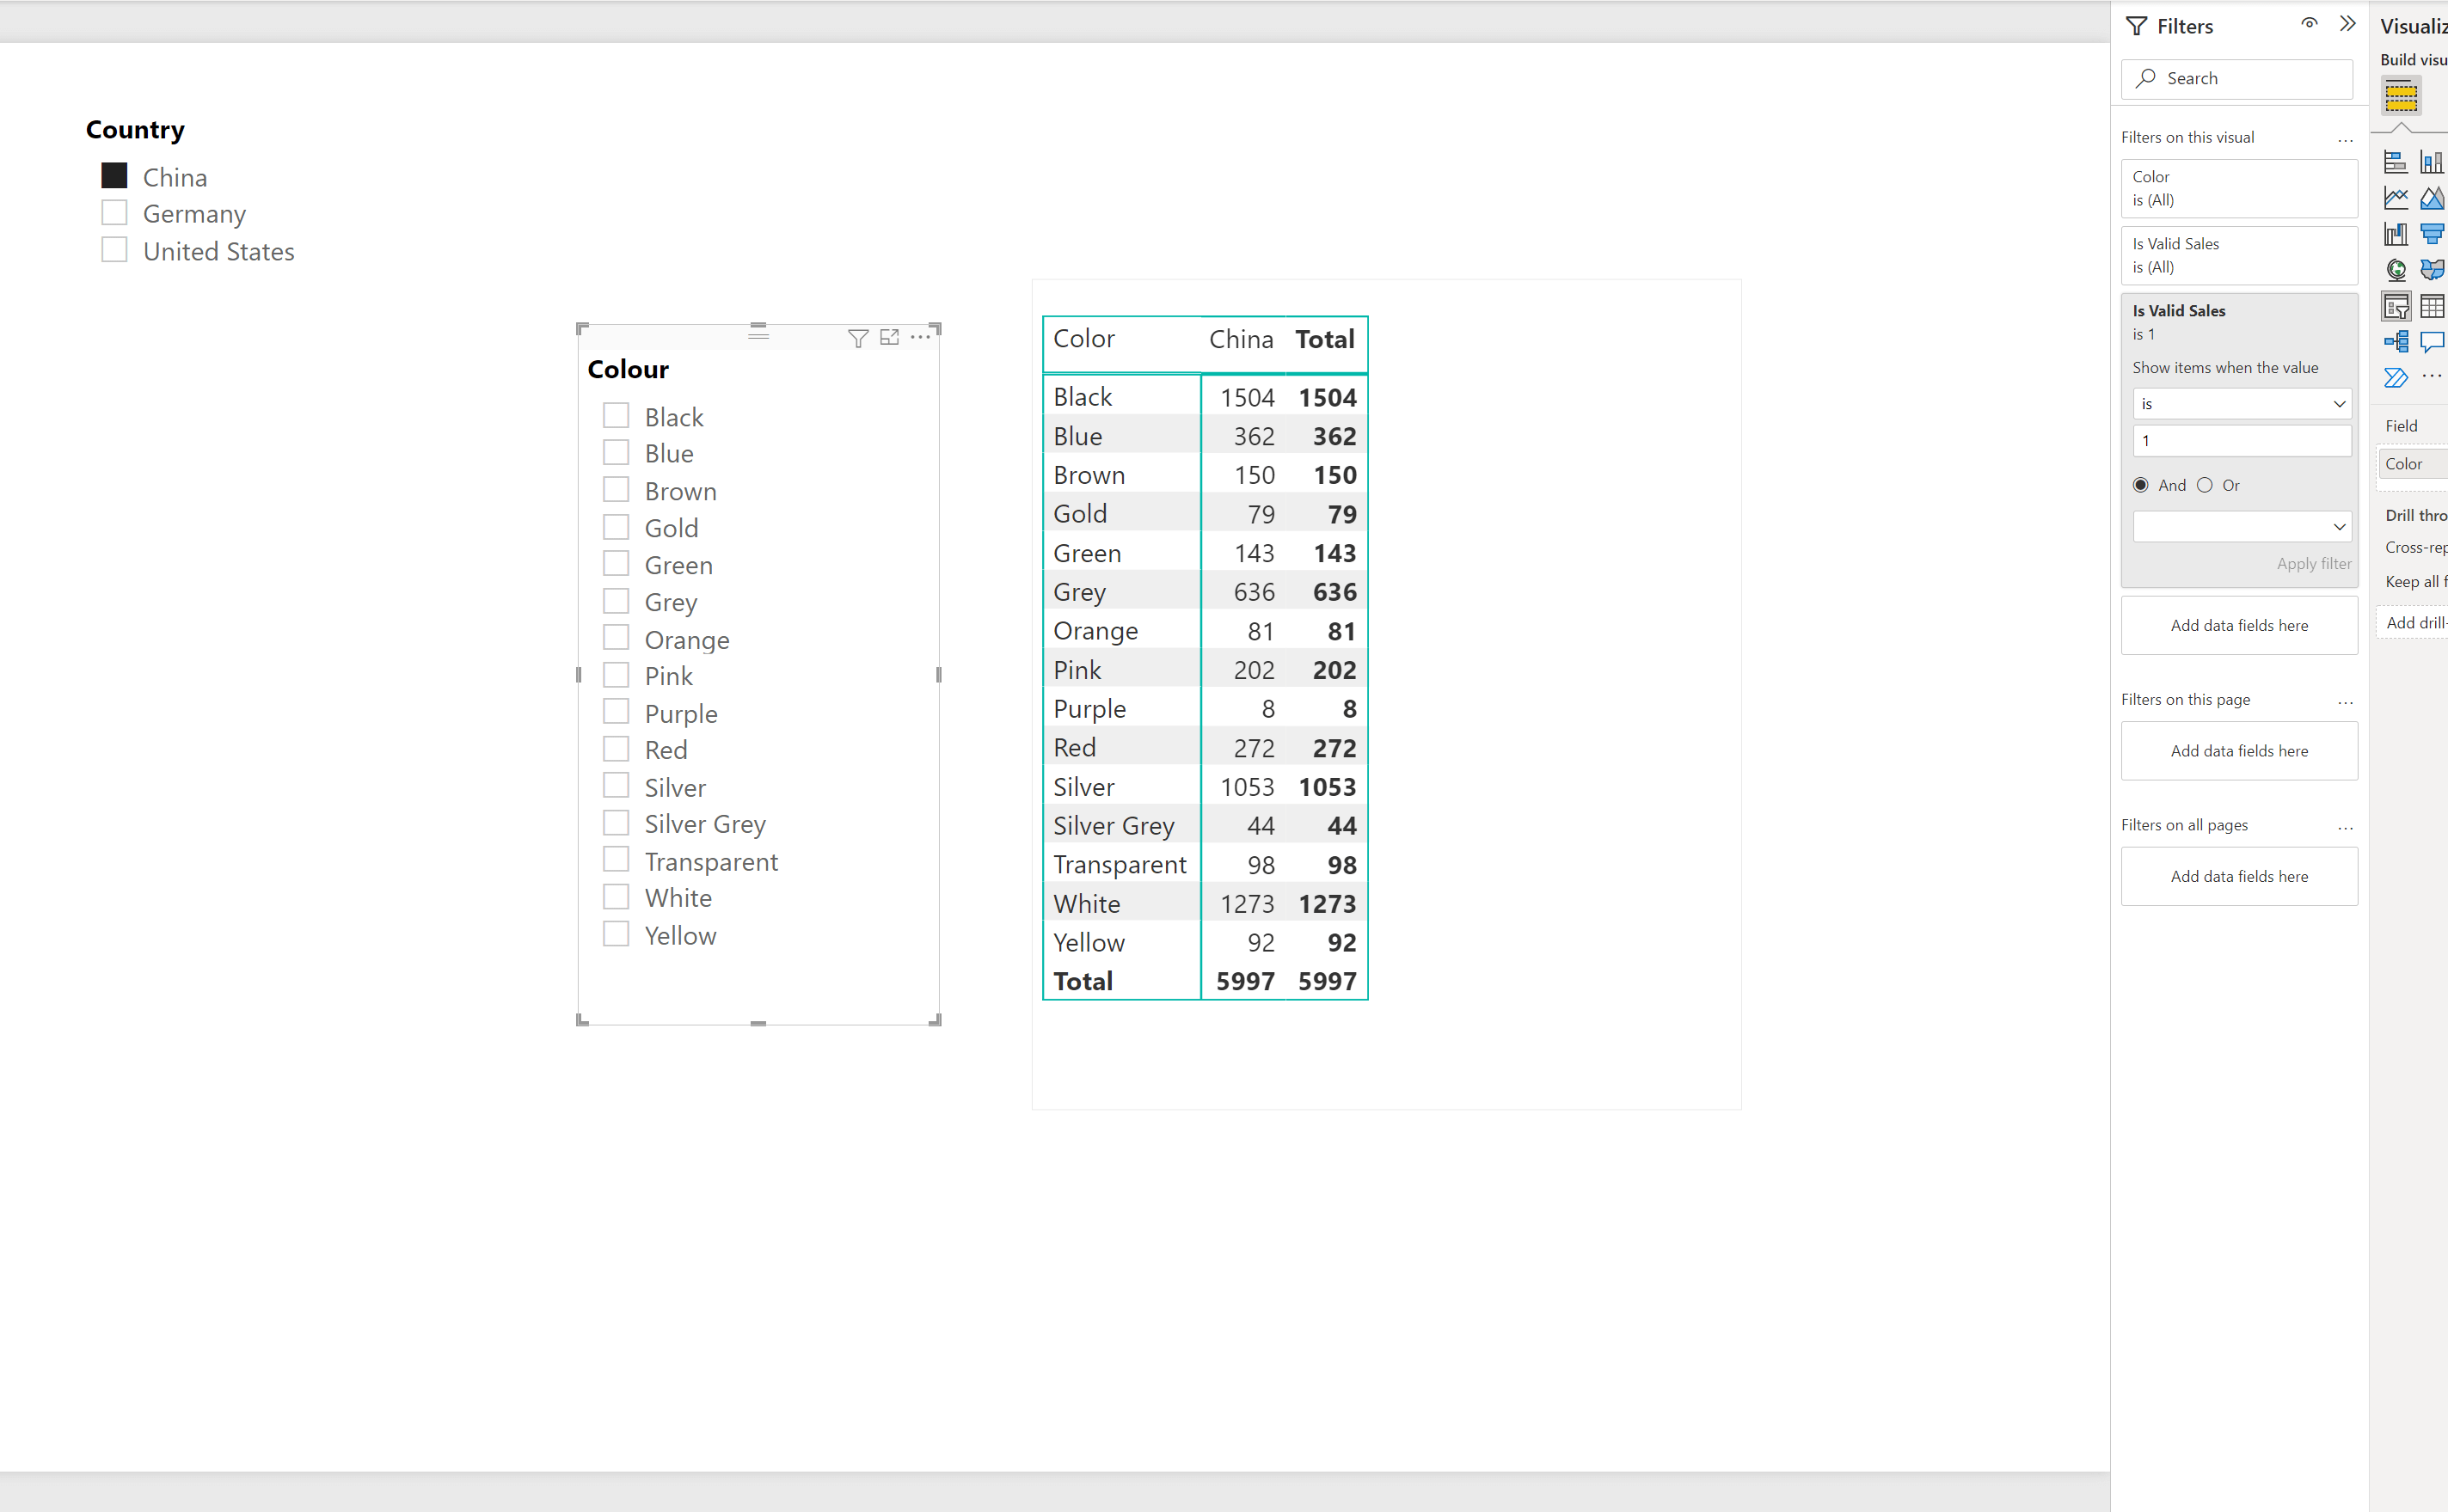
Select the slicer for State and, on the Filters pane, add the newly created measure as a filter on the visual. Set the filter to show items when the value is 1. In other words, we are setting the filter to show the values for which the Sales table contains one or more rows.
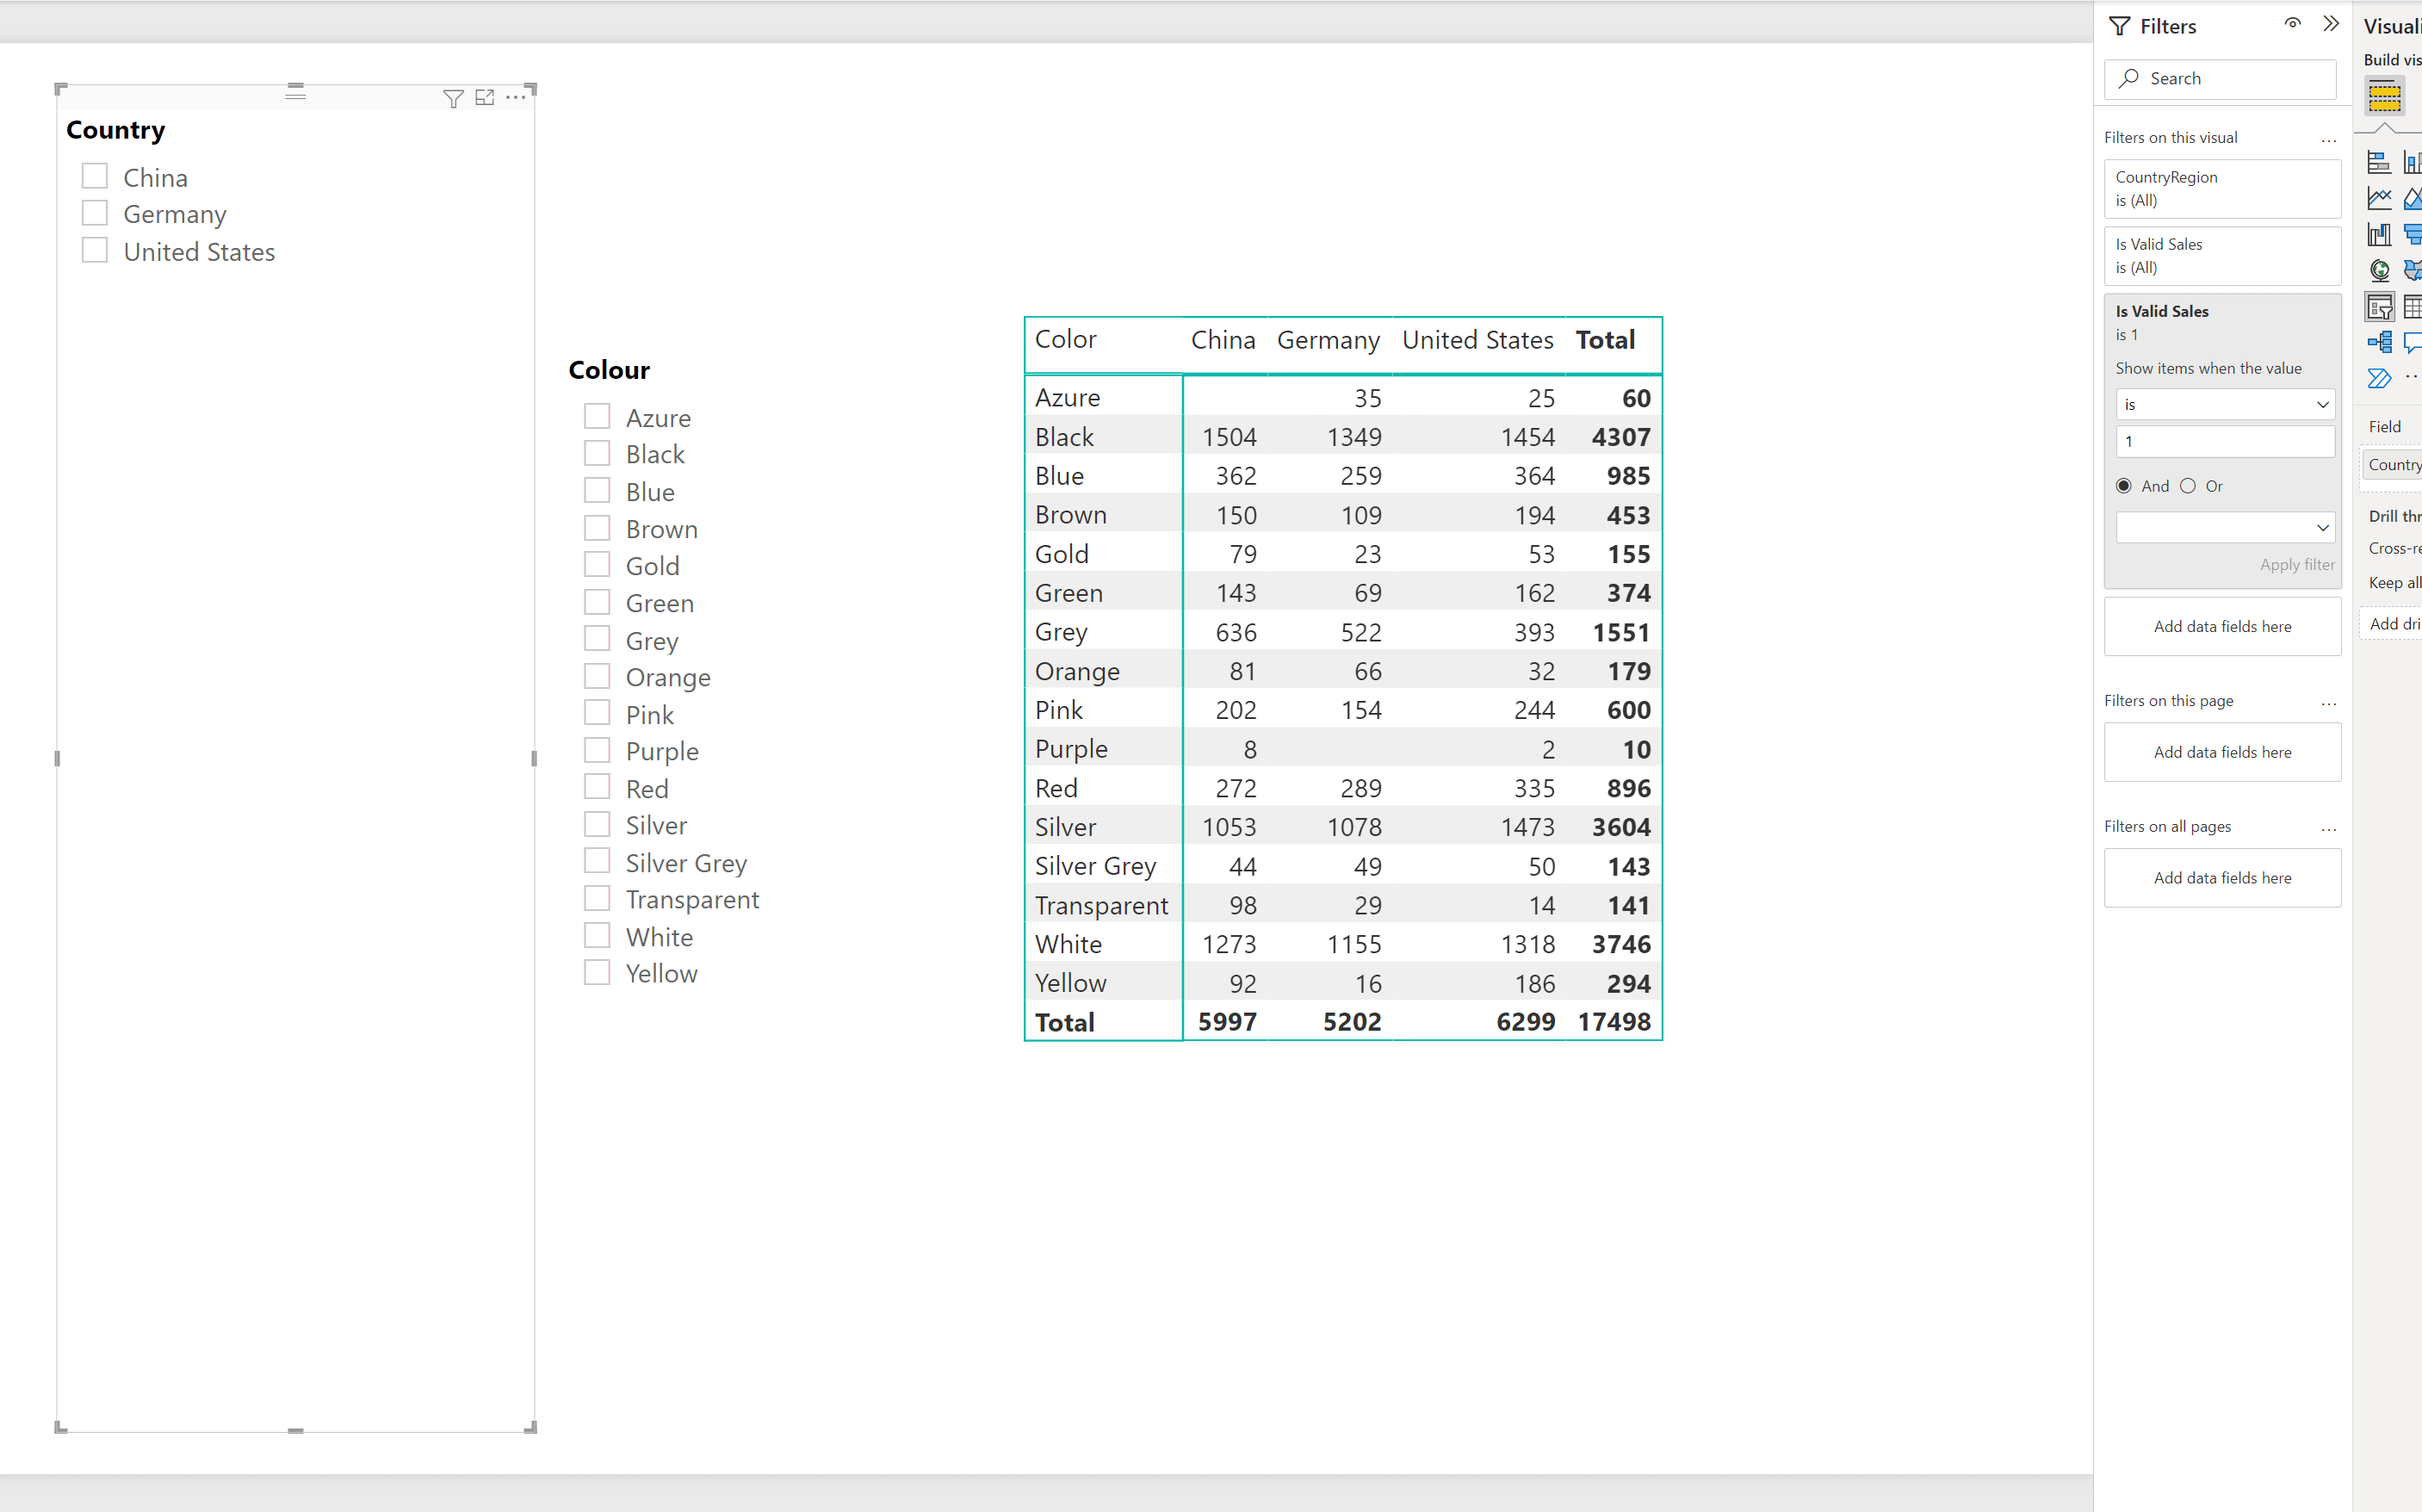
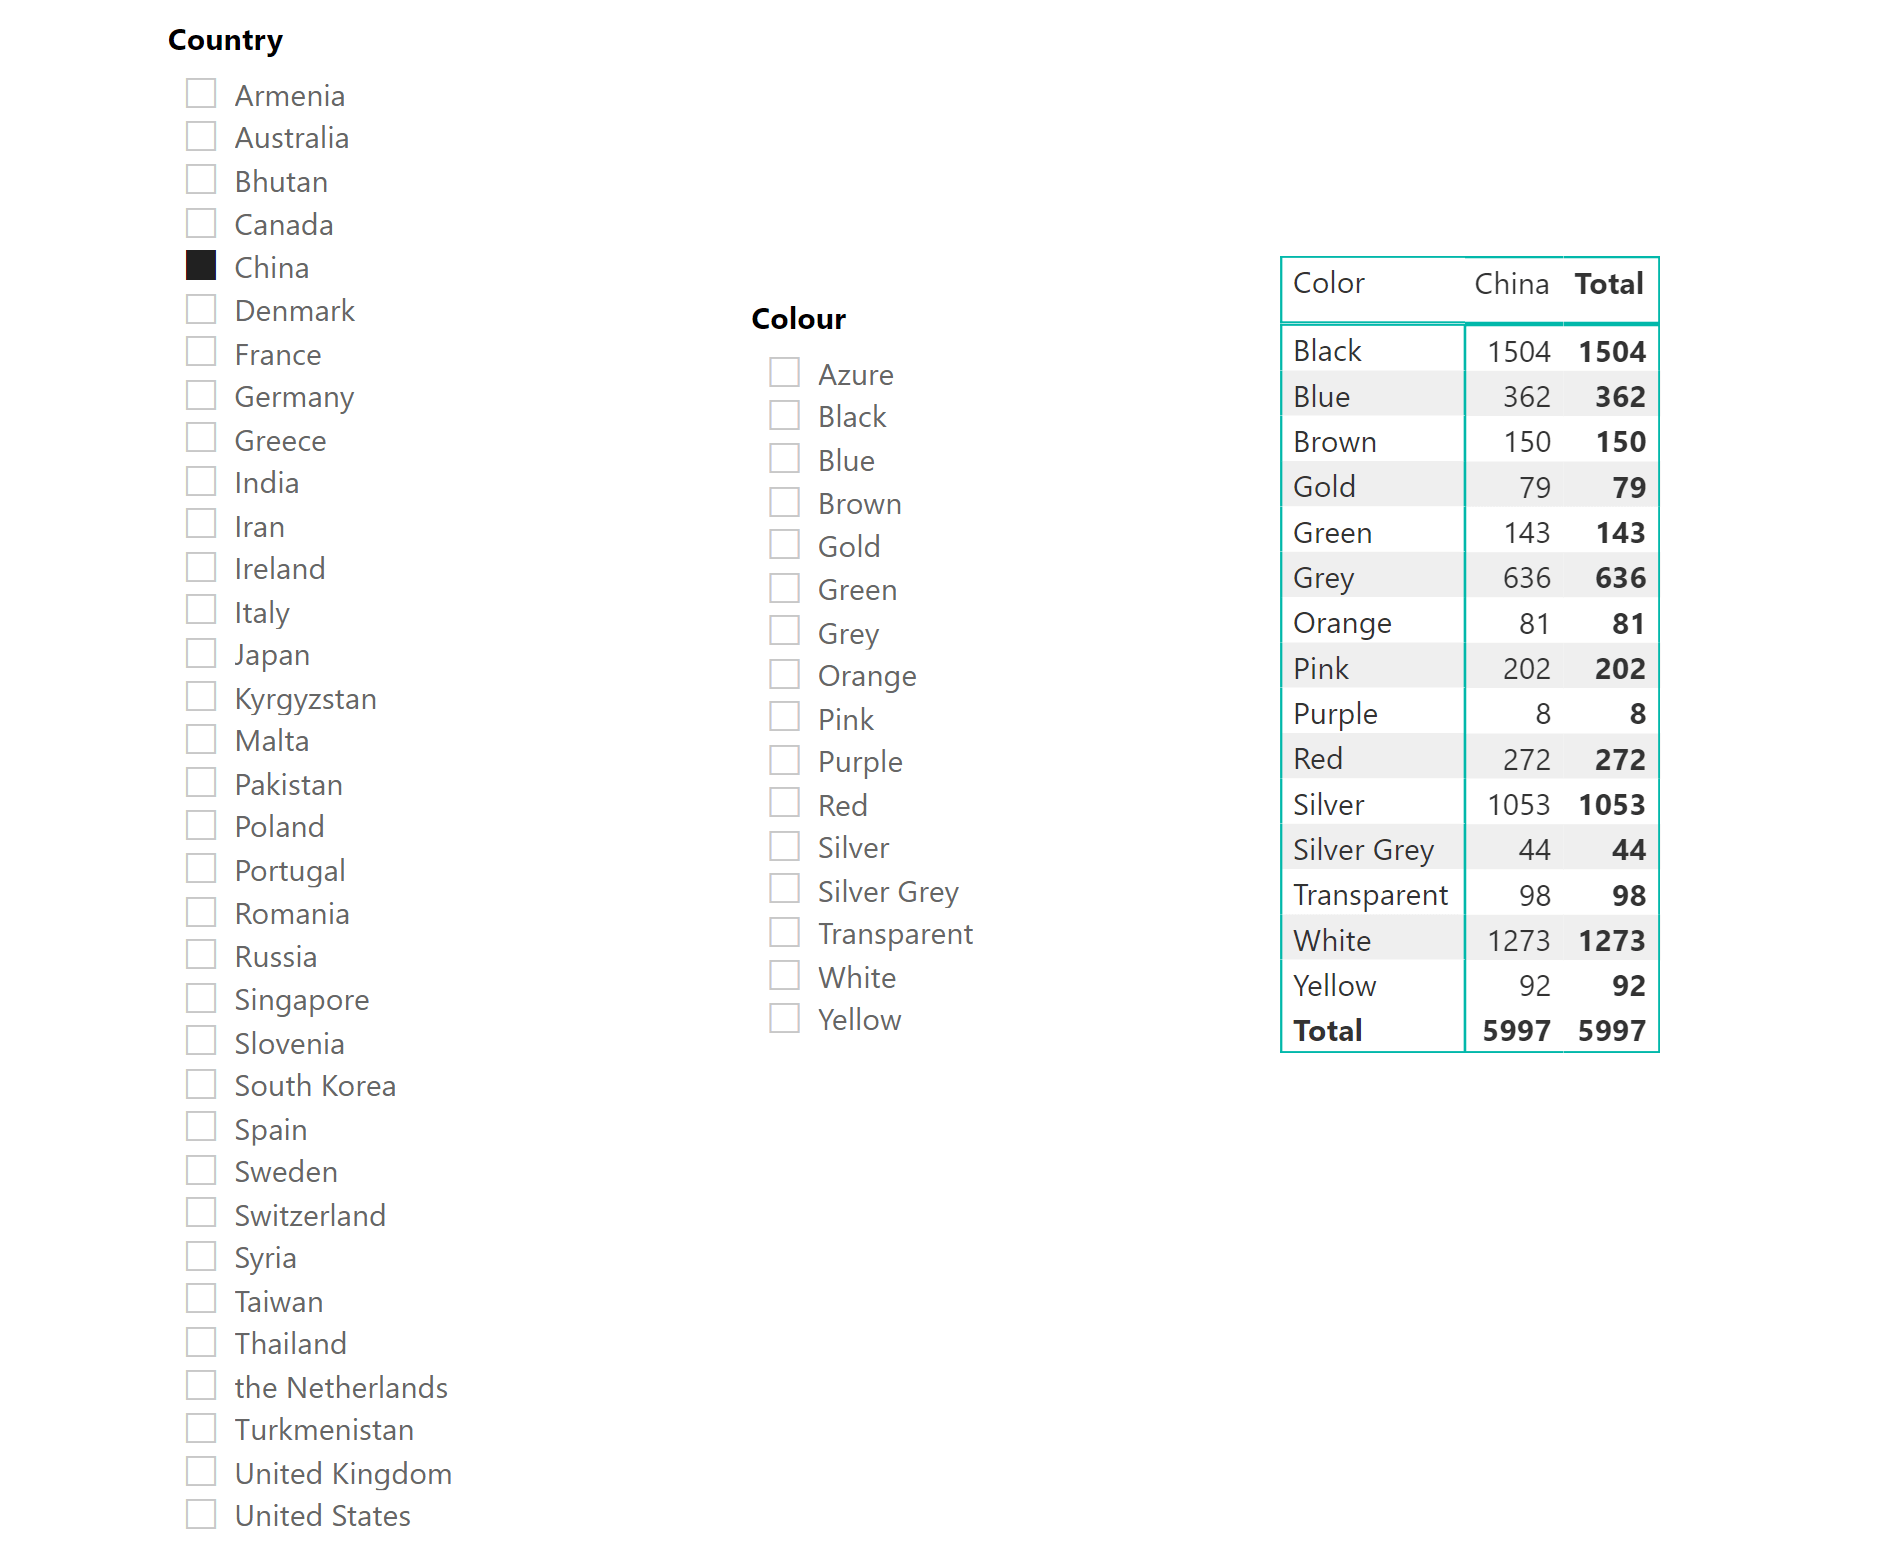
Now, our slicer shows only three countries, the ones for which there are sales.
Next, repeat the same for the colour slicer. Add the measure as a filter on the visual and set it to 1.
Now, selecting China in the Country slicer filters the second slicer to display only the colours for which Sales were made in that country.
Conclusion
In this post, we have seen a solution for enabling two dimension tables to filter each other. The solution only requires a measure that counts the rows in the fact table, thus filtering out any rows in the dimension table that yield an empty fact table. Using this measure as a filter on visuals allows us to enable the desired behaviour without modifying the model.