Browse our archives by topic…
Analytics

Insight Discovery (part 4) – Data projects should have a backlog
Many data projects fail to deliver the impact they should for a simple reason – they focus on the data. This series of posts explains a different way of thinking that will set up your data & analytics projects for success. Using an iterative, action-oriented, insight discovery process, it demonstrates tools and techniques that will help you to identify, define and prioritize requirements in your own projects so that they deliver maximum value. It also explores the synergy with modern cloud analytics platforms like Azure Synapse, explaining how the process and the architecture actively support each other for fast, impactful delivery.

Insight Discovery (part 3) – Defining Actionable Insights
Many data projects fail to deliver the impact they should for a simple reason – they focus on the data. This series of posts explains a different way of thinking that will set up your data & analytics projects for success. Using an iterative, action-oriented, insight discovery process, it demonstrates tools and techniques that will help you to identify, define and prioritize requirements in your own projects so that they deliver maximum value. It also explores the synergy with modern cloud analytics platforms like Azure Synapse, explaining how the process and the architecture actively support each other for fast, impactful delivery.
How to enable data teams with the design assets required for impactful data storytelling in Power BI
In this post we will talk through how to expand on a data team's creative skillset, without access to specialist photo editing software such as Photoshop or Illustrator.

5 tips to pass the PL-300 exam: Microsoft Power BI Data Analyst
I recently passed the PL-300 - Power BI Data Analyst exam. Here are some tips to prepare for it that I found useful!

Insight Discovery (part 2) – successful data projects start by forgetting about the data
Many data projects fail to deliver the impact they should for a simple reason – they focus on the data. This series of posts explains a different way of thinking that will set up your data & analytics projects for success. Using an iterative, action-oriented, insight discovery process, it demonstrates tools and techniques that will help you to identify, define and prioritize requirements in your own projects so that they deliver maximum value. It also explores the synergy with modern cloud analytics platforms like Azure Synapse, explaining how the process and the architecture actively support each other for fast, impactful delivery.

Performance Optimisation Tools for Power BI
Performance tuning is an important aspect of Power BI report development. This blog post highlights useful analyzer tools you can utilise to optimise the performance of your Power BI reports.

Insight Discovery (part 1) – why do data projects often fail?
Many data projects fail to deliver the impact they should for a simple reason – they focus on the data. This series of posts explains a different way of thinking that will set up your data & analytics projects for success. Using an iterative, action-oriented, insight discovery process, it demonstrates tools and techniques that will help you to identify, define and prioritize requirements in your own projects so that they deliver maximum value. It also explores the synergy with modern cloud analytics platforms like Azure Synapse, explaining how the process and the architecture actively support each other for fast, impactful delivery.
Automating Excel in the Cloud with Office Scripts and Power Automate
Office Scripts and Power Automate provide the ability to automate manual processes involving Excel in the cloud. This post provides and overview and walks through an example.

How to apply behaviour driven development to data and analytics projects
In this blog we demonstrate how the Gherkin specification can be adapted to enable BDD to be applied to data engineering use cases.
Sharing access to synchronized Shared Metadata Model objects in Azure Synapse Analytics
The "Shared Metadata Model" is a powerful feature within Synapse Analytics that synchronizes Spark database objects with SQL Serverless. This article describes how to give non-admin users access to these synchronized objects in a least-privileged manner.
What is the Shared Metadata Model in Azure Synapse Analytics, and why should I use it?
A lesser known feature of Azure Synapse is the "Shared Metadata Model". Synapse has the capability to automatically synchronize tables created via Synapse Spark with objects you can query via the usual SQL Serverless endpoint, without any additional configuration. This article brings attention to this capability, highlighting the benefits and tradeoffs vs rolling your own SQL Serverless VIEWs.
Context Transition in DAX
This blog post explores how the CALCULATE function in DAX performs context transition.

Excel, data loss, IEEE754, and precision
The world runs on Excel, and misuse has caused some infamous data loss incidents. This post explores what happens when identifiers fall foul of Excel's numeric precision rules.
CALCULATE in DAX
This blog post explores one of the most powerful functions in DAX - CALCULATE.

RELATED and RELATEDTABLE in DAX
This blog post explores two common functions in DAX - RELATED and RELATEDTABLE.

Extract insights from tag lists using Python Pandas and Power BI
We often come across spreadsheets and CSV files that contain features which are a list of tags or categories. This blog article walks through a simple way of extracting insights from this data using a combination of Pandas for data wrangling and Power BI for analytics and visualisation.

Filtering unrelated tables in Power BI
Star Schemas are designed to be able to filter the fact table by any dimension. But in some cases, we might also want to filter a dimension table by another dimension. Here's a clean way of doing so.
How to dynamically switch between measures in Power BI visuals with Field Parameters
Field Parameters allow users to dynamically change the measure being analysed within a report. This blog post will explore how to use the new Field Parameters feature to dynamically switch between measures in a visua.

Table Functions in DAX: DISTINCT
This blog post explores one of the most common table functions in DAX - DISTINCT.

Table Functions in DAX: FILTER and ALL
This blog post explores two of the most common table functions in DAX - FILTER and ALL.
Measures vs Calculated Columns in DAX and Power BI
This blog post explains the difference between measures and calculated columns in DAX and Power BI. It will also explore when to use a measure vs. when to use a calculated column.
SQLbits 2022 - The Best Bits
This is a summary of the sessions I attended at SQLbits 2022 in London, which is Europe's largest expert led data conference.
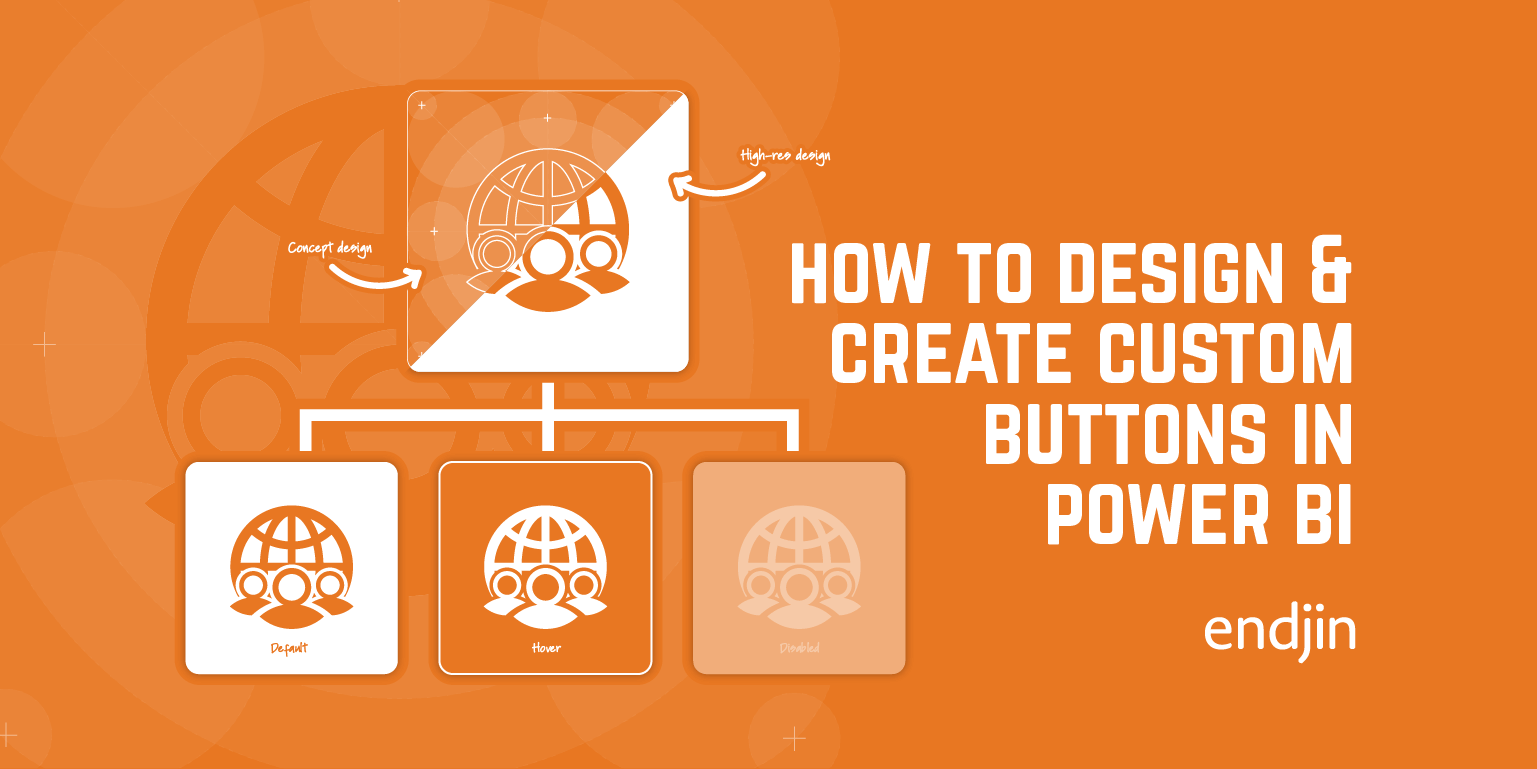
How to Create Custom Buttons in Power BI
In this post we will talk through a step-by-step guide for how to design and build custom buttons in Power BI. We'll start with the basic foundations of shape and form, to applying icons, states, and actions with the view to extending your brand collateral across your report design and UI.

A visual approach to demand management and prioritisation
Spending more time planning then doing? Struggling to get stakeholders engaged in making tough decisions about prioritisation? This simple, light touch approach to visual prioritisation could help.
Evaluation Contexts in DAX - Context Transition
In this third and final part of this series, we learn how CALCULATE performs Context Transition when used inside of a filter context.

Evaluation Contexts in DAX - Relationships
After learning about the two different types of evaluation contexts in our previous post, we now talk about table relationships and how these interact with the filter and row contexts to condition the output of our DAX code.
Testing Power BI Reports with the ExecuteQueries REST API
Despite being inherently difficult to test, the need to validate data modelling, business rules and security boundaries in Power BI reports is important, as well as the need for ensuring that quality doesn't regress over time as the insights evolve. This post explains that, by executing DAX queries over underlying tabular model, it is possible to execute scenario-based specifications to add quality gates and build confidence in Power BI reports, just as any other software project.

How to Build a Branded Power BI Report Theme
This is the first post in a series where we begin to explore how to translate a companies brand and visual identity into Power BI report, and how adopting a new platform could mean that you need to extend your visual identity and brand language to include Power BI

Evaluation Contexts in DAX - Filter and Row Contexts
DAX is a powerful query language used in tools such as Power BI. In this post, we explain how to better understand the results obtained through DAX formulas by being aware of the different types of Evaluation Contexts and how these affect our code.

Why you should care about the new Power BI ExecuteQueries API
The new Power BI ExecuteQueries REST API presents a number of new opportunities for Power BI developers in terms of tooling, process and integrations. This post highlights some of the key advantages of this new capability.

Data is the new soil
Thinking of data as the new soil is useful in highlighting the key elements that enable a successful data and analytics initiative.
How to use Azure Synapse SQL Serverless to connect Data Lake and Power BI
TL;DR - Using Azure Synapse SQL Serverless, you can query Azure Data Lake and populate Power BI reports across multiple workspaces.
How to test Azure Synapse notebooks
Interactive Spark notebooks are an incredibly powerful tool for data exploration and experimentation. And in Azure Synapse, the time to (business) value is significantly decreased due to tight integration with Pipelines and monitoring tooling. But as with any software process, the need to validate business rules is important, as is ensuring that quality doesn't regress over time - especially so in such a collaborative and productive environment. This post looks at some simple ways to add testing to your Synapse Notebooks.

Do robots dream of counting sheep?
Some of my thoughts inspired whilst helping out on the farm over the weekend. What is the future of work given the increasing presence of machines in our day to day lives? In which situations can AI deliver greatest value? How can we ease the stress of digital transformation on people who are impacted by it?

How to safely reference a nullable activity output in Azure Synapse Pipelines and Azure Data Factory
Did you know that there's a null-safe operator in Azure Data Factory's expression syntax? No? Well, now you do. Here's how you can safely reference an activity output that might not always exist.

How Azure Synapse unifies your development experience
Modern analytics requires a multi-faceted approach, which can cause integration headaches. Azure Synapse's Swiss army knife approach can remove a lot of friction.

How do I know if my data solutions are accurate?
Data insights are useless, and even dangerous (as we've seen recently at Public Health England) if they can't be trusted. So, the need to validate business rules and security boundaries within a data solution is critical. This post argues that if you're doing anything serious with data, then you should be taking this seriously.
How to fix the "You need permission to access workspace..." error in Azure Synapse Analytics
Data Engineers/Developers want to get access to Azure Synapse Analytics as quickly as possible to start designing and creating their data solutions. Being denied access to Synapse Studio can be frustrating and slows matters down. This article will address the "You need permission to access workspace..." error, discuss what causes it, and describe how to fix it.
How to use the Azure CLI to manage access to Synapse Studio
Azure Synapse Analytics developers need to be assigned a role within Synapse Studio in order to access the GUI. The Azure CLI provides one way of programmatically achieving this, which can be done by any Owner or Contributor of the Azure Synapse Analytics resource.

The Public Health England Test and Trace Excel error could have been prevented by this one simple step
Despite the subsequent media reporting, the loss of 16,000 Covid-19 test results at Public Health England wasn't caused by Excel. This post argues that a lack of an appropriate risk and mitigation analysis left the process exposed to human error, which ultimately led to the loss of data and inaccurate reporting. It describes a simple process that could have been applied to prevent the error, and how it will help if you're worried about ensuring quality or reducing risk in your own business, technology or data programmes.

Does Azure Synapse Link redefine the meaning of full stack serverless?
Azure Synapse Link for Cosmos DB is a game-changing piece in the Synapse suite of services - extending the support for SQL on Demand to enable querying over the Cosmos DB Analytical Store. This post explores whether the term 'full stack serverless' should now be extended to cover No-ETL and pay-as-you-query analytics, alongside serverless application architectures.

How to use SQL Notebooks to access Azure Synapse SQL Pools & SQL on demand
Wishing Azure Synapse Analytics had support for SQL notebooks? Fear not, it's easy to take advantage rich interactive notebooks for SQL Pools and SQL on Demand.
Deploy an Azure Synapse Analytics workspace using an ARM Template
Azure Synapse Analytics is Microsoft's new unified cloud analytics platform, which will surely be playing a big part in many organizations' technology stacks in the near future. For many organizations, Azure Resource Manager (ARM) templates are the infrastructure deployment method of choice. This blog explains how to deploy an Azure Synapse Analytics workspace using an ARM template.

Azure Synapse Analytics: How serverless is replacing the data warehouse
Serverless data architectures enable leaner data insights and operations. How do you reap the rewards while avoiding the potential pitfalls?

Quick tip – Removing totals from a matrix in Power BI
Here is a quick tip on how to remove column summarisation from a matrix in Power BI!
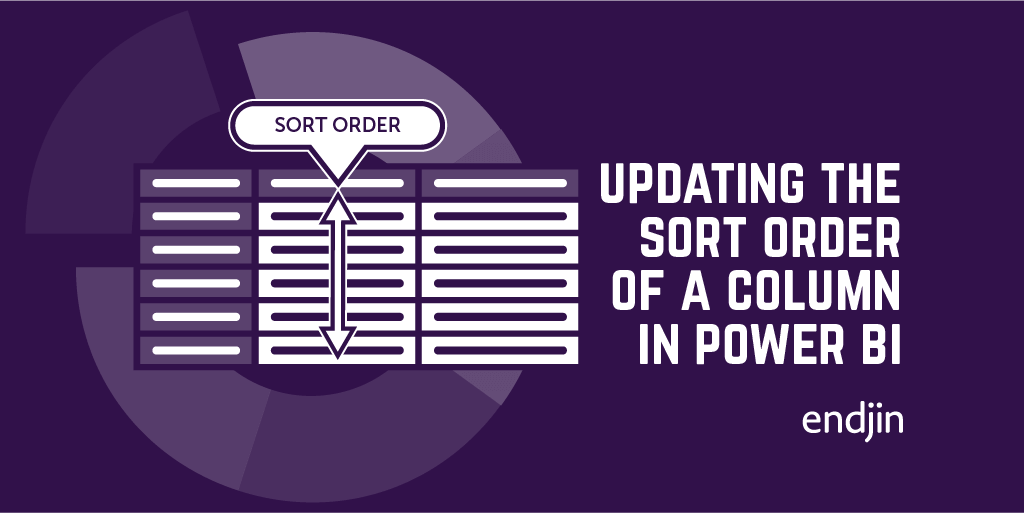
Quick tip – Updating the sort order of a column in Power BI (avoiding circular references)
Here's a quick tip on how to alter the sort order of a column in Power BI!
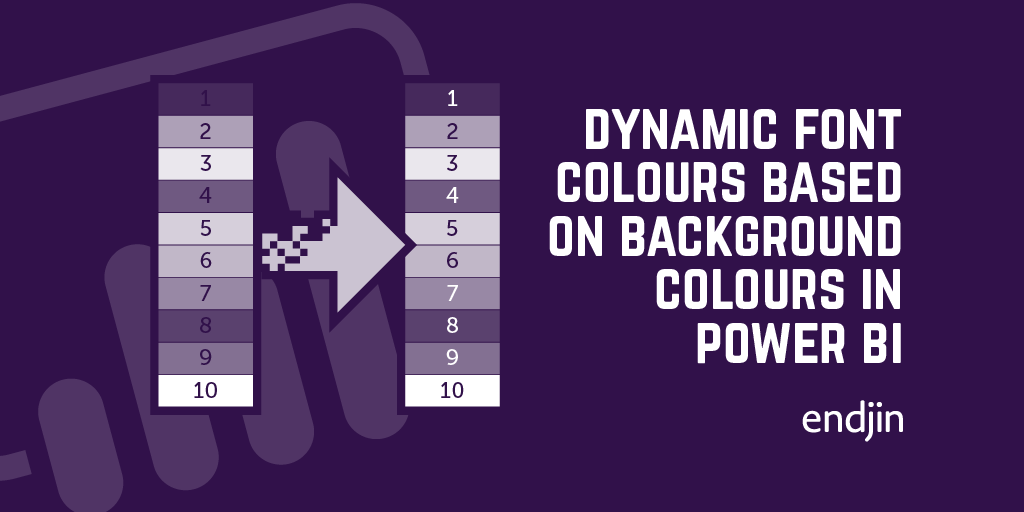
How to dynamically choose the correct font colour based on a background colour in Power BI tables.
Making your Power BI reports accessible is crucial, and one important aspect is legibility. If you're using background colours to represent certain categories, then you need any text that's used in conjunction with that background to be as clear as possible. This blog demonstrates how to dynamically select the best font colour to overlay on any chosen background colour.

Benchmarking Azure Synapse Analytics - SQL Serverless, using .NET Interactive
There is a new service in town that promises to transform the way you query the contents of your data lake. Azure Synapse Analytics comes with a new offering called SQL Serverless allowing you to query your data on-demand with no need for pre-provisioned resources.When we heard about the new service we were keen to get involved, so for the last 10 months we've been working with the SQL Serverless product group to provide feedback on the service and to help ensure it meets our customers needs. During this time we've put it through it's paces by implementing a range of real-world use cases. We were particularly interested to see how it stacked up as a replacement for Data Lake Analytics, where to date there has been no clear and easy migration path.
Azure Synapse for C# Developers: 5 things you need to know
Did you know that Azure Synapse has great support for .NET and #csharp? Learning new languages is often a barrier to digital transformation, being able to use existing people, skills, tools and engineering disciplines can be a massive advantage.

5 Reasons why Azure Synapse Analytics should be on your roadmap
For years we have been building modern cloud data solutions on Azure and helping our customers transform their use of data to drive outcomes. Here are 5 reasons why Azure Synapse Analytics might just be the service that we have been crying out for.
Power BI Embedded: Convention-based dynamic Row-level Security
Power BI Embedded is a great tool for ISVs offering a BI product for their customers. Generally, the reports exposed to the customers are personalized to some extent - one can use the Power BI JavaScript library to interact with the reports and tweak the visuals based on the logged-in user. Another way reports differ from user to user is the underlying data that user is allowed to see. This is controlled using Row-level Security. A standard method to implement Row-level security is to pass the user's email address to the data model, and have rules filter the data model appropriately based on the data that user is permitted to see. However, sometimes it can be useful to filter the data model based on more than just a user's email address. This blog indicates how to modify an Embed Request (made by Power BI Embedded) to provide additional context on what data the embedding application would like to be returned for a user to view on a report.

How can I improve my data model in Power BI?
Configuring model properties in Power BI allows you to create a model which is far more discoverable and is able to better support the visualisations you need. There are several different model properties which can be configured, some of these focus on discoverability whilst others allow you to alter the ways in which data is sorted/displayed/summarised in the reports.

Why Power BI developers should care about the new read/write XMLA endpoint
Whilst "read/write XMLA endpoint" might seem like a technical mouthful, its addition to Power BI is a significant milestone in the strategy of bringing Power BI and Analysis Services closer together. As well as closing the gap between IT-managed workloads and self-service BI, it presents a number of new opportunities for Power BI developers in terms of tooling, process and integrations. This post highlights some of the key advantages of this new capability and what they mean for the Power BI developer.

Learning DAX and Power BI – CALCULATE
This is the final blog in a series about DAX and Power BI. This post focuses on the CALCULATE function, which is a unique function in DAX. The CALCULATE function has the ability to alter filter contexts, and therefore can be used to enable extremely powerful and complex processing. This post covers some of the most common scenarios for using CALCULATE, and some of the gotchas in the way in which these different features interact!
Testing Power BI Reports using SpecFlow and .NET
Despite being inherently difficult to test, the need to validate data modelling, business rules and security boundaries in Power BI reports is important, as well as the need for ensuring that quality doesn't regress over time as the insights evolve. This post explains that, by connecting to the underlying tabular model, it is possible to execute scenario-based specifications to add quality gates and build confidence in Power BI reports, just as any other software project.

Data modelling with Power BI - Loading and shaping data
In order to effectively work with our data in Power BI we need to structure the model as best to support the representations we need. This process is called data modelling. Data modelling includes loading, shaping, cleansing and enhancing the data.This post runs through some of the important steps used in data modelling, and gives an example of loading and shaping data using Power BI.

Learning DAX and Power BI – Related Tables and Relationships
This is the sixth blog in a series about DAX and Power BI. This post focuses on relationships and related tables. These relationships allow us to build up intricate and powerful models using a combination of sources and tables. The use of relationships in DAX powers many of the features around slicing and page filtering of reports.

Recording of Azure Oxford talk on combatting illegal fishing with Azure (for less than £10/month)
Jess and Carmel recently gave a talk at Azure Oxford on "Combatting illegal fishing with Machine Learning and Azure - for less than £10 / month). The recording of that talk is now available for viewing!The talk focuses on the recent work we completed with OceanMind. They run through how to construct a cloud-first architecture based on serverless and data analytics technologies and explore the important principles and challenges in designing this kind of solution. Finally, we see how the architecture we designed through this process not only provides all the benefits of the cloud (reliability, scalability, security), but because of the pay-as-you-go compute model, has a compute cost that we could barely believe!

Testing Power BI Dataflows using SpecFlow and the Common Data Model
Whilst testing Power BI Dataflows isn't something that many people think about, it's critical that business rules and associated data preparation steps are validated to ensure the right insights are available to the right people across the organisation. Data insights are useless, even dangerous, if they can't be trusted, so despite the lack of "official support" or recommended approaches from Microsoft, endjin treat Power BI solutions just as any other software project with respect to testing - building automated quality gates into the end to end development process. This post outlines an approach that endjin has used to test Power BI Dataflows to add quality gates and build confidence in large and complex Power BI solutions.

Learning DAX and Power BI – Table Functions
This is the fifth blog in a series on DAX and Power BI. This post focuses on table functions. In DAX, table functions return a table which can then be used for future processing. This can be useful if, for example, you want to perform an operation over a filtered dataset. Table functions, like most functions in DAX, operate under the filter context in which they are applied.

Azure Analysis Services - how to save money with automatic shutdown
Azure Analysis Services provides an enterprise-grade analytical platform with massive scale and flexibility. But, as one of the more expensive services in the Azure platform, consideration should be given to cost management, especially in multi-environment ALM scenarios. This post explains how to massively reduce running costs through automation using Powershell and orchestration tools like Azure DevOps.

Learning DAX and Power BI - Aggregators
This is the fourth blog in a series about DAX and Power BI. We have so far covered filter and row contexts, and the difference between calculated columns and measures. This post focuses on aggregators. We cover the limitations of the classic aggregators, and demontrate the power of the iterative versions. We also highlight some of the less intuitive features around how these functions interact with both filter and row contexts.

Power BI Dataflow refresh polling
If you're a frequent user of the Power BI REST API and Power BI Dataflows, you may have come across the problem that there's seemingly no programmatic way to get the refresh history of a Dataflow. The ability to know the status of a refresh operation is useful when you're performing automated operations, and you need to know that something has succeeded or failed before deciding what to do next. For example, a desired feature in the Power BI Service is to be able to refresh a dataflow, and automatically refresh a dataset that depends on that dataflow. Without a refresh history endpoint, this is made more complicated than necessary. This blog outlines a way to programmtically retrieve a Dataflow's refresh history in order to poll a refresh operation's status, useful for any fully automated scenario.
Azure Analysis Services: How to update the expression for a calculated column from .NET
This post explains how to update Azure Analysis Services model schemas from inside custom .NET applications. Whilst not a common scenario for most, it shows that this is easy to do using the AMO SDK. So, there's nothing stopping you from developing complex and rich end-user functionality over the top of your data analysis solutions - providing run-time, user-driven schema changes like "what if" analysis.

Wardley Maps - Explaining how OceanMind use Microsoft Azure & AI to combat Illegal Fishing
Wardley Maps are a fantastic tool to help provide situational awareness, in order to help you make better decisions. We use Wardley Maps to help our customers think about the various benefits and trade-offs that can be made when migrating to the Cloud. In this blog post, Jess Panni demonstrates how we used Wardley Maps to plan the migration of OceanMind to Microsoft Azure, and how the maps highlighted where the core value of their platform was, and how PaaS and Serverless services offered the most value for money for the organisation.

Learning DAX and Power BI – Calculated Columns and Measures
This is the third blog in a series about learning DAX and Power BI. The first two blogs focused on filter and row contexts. We are now moving on to talk about calculated columns and measures. These are the main features used to support the display of complex visuals. They allow you to combine columns, aggregate values, reformat data, and much more. The difference between these features can get a bit confusing so we've attempted to make that clearer using some concrete examples!
Optimising C# for a serverless environment
In our recent project with OceanMind we used #AzureFunctions to process marine vessel telemetry from around the world. This involved processing huge quantities of data in close to real time. We optimised our processing for a serverless environment, the outcome of which being that the compute would cost less than £10 / month!This post summarises some of the techniques we used, including some concrete examples of optimisations we made.

Learning DAX and Power BI – Row Contexts
Here is the second blog in a series around learning DAX and Power BI. This post focuses on row contexts, which are used when iterating over the rows of a table when, for example, evaluating a calculated column. Row contexts along with filter contexts underpin the basis of the DAX language. Once you understand this underlying theory it is purely a case of learning the syntax for the different operations which are built on top of it.
Azure Analysis Services - How to process an asynchronous model refresh from .NET
Integrating Azure Analysis Services into custom applications doesn't just mean read-only data querying. But if your application changes the underlying model, it will need to be re-processed before the changes take effect. This post describes how to use the REST API for Azure Analysis Services inside a custom .NET application to perform asynchronous model refreshes, meaning your applications can reliably and efficiently deal with model updates.

Learning DAX and Power BI - Filter Contexts
Here is the first in a series of blog posts around understanding DAX and Power BI. This post focuses on filter contexts. which are a central concept which is vital for being able to write effective and powerful DAX!In this series Carmel walks through the main ideas and syntax surrounding the DAX language, and provides examples of using these over a dataset. DAX is an extremely powerful language. Using these techniques it is possible to build up complex reports which provide the insight you really need!
Azure Analysis Services: How to execute a DAX query from .NET
Being able to construct DAX queries dynamically in C# means the possibilities are endless in terms of integrating Azure Analysis Services queries into your custom applications, and with the code samples in this post, you have everything you need to get started.

British Science Week - inspiring the next generation of data scientists
The theme of this year's British Science Week (6 - 15 March 2020) is "Our Diverse Planet". We'll be getting involved by speaking to school children about the work we've been doing with Oxfordshire-based OceanMind (part of the Microsoft AI for Good programme) to help them combat illegal fishing, hopefully inspiring some of the next generation of data scientists!
Azure Analysis Services - How to query all the measures in a model from .NET
Integrating Azure Analysis Services into custom applications means more than just querying the data. By surfacing the metadata in your models, you can build dynamic and customisable UIs and APIs, tailored to the needs of the client application. This post explains how easy it is to query model metadata from .NET, so you can create deeper integrations between your data insights and your custom applications.
Azure Analysis Services: How to open a connection from .NET
One of the first steps in integrating Azure Analysis Services into your applications is creating and opening a connection to the server - just like any other database technology. This post explains the ins and outs of creating Azure Analysis Services connections, including code samples for each of the key scenarios.

NDC London 2020 - My highlights
Ed attended NDC London 2020, along with many of his endjin colleagues. In this post he summarises and reflects upon his favourite sessions of the conference including; "OWASP Top Ten proactive controls" by Jim Manico, "There's an Impostor in this room!" by Angharad Edwards, "How to code music?" by Laura Silvanavičiūtė, "ML and the IoT: Living on the Edge" by Brandon Satrom, "Common API Security Pitfalls" by Philippe De Ryck, and "Combatting illegal fishing with Machine Learning and Azure - for less than £10 / month" by Jess Panni & Carmel Eve.
Azure Analysis Services - integration options using .NET, REST APIs and PowerShell
With a variety of integration support through client SDKs, PowerShell cmdlets and REST APIs, it can be hard to know where to start with integrating Azure Analysis Services into your custom applications. This posts walks through the options, and lays out a simple guide to choosing the right framework.

Azure Analysis Services: 8 reasons why you might want to integrate into a custom application
We've done a lot of work at endjin with Azure Analysis Services over the last couple of years - but none of it has been what you'd call "traditional BI". We've pulled, twisted and bent it in all sorts of directions, using it's raw analytical processing power to underpin bespoke analysis products and processes. This post explains some of the common (and not-so-common) reasons why you might want to do similar things, and how Azure Analysis Services might be the key to unlocking your data insights.

Building a secure data solution using Azure Data Lake Store (Gen2)
In this blog from the Azure Advent Calendar 2019 we discuss building a secure data solution using Azure Data Lake. Data Lake has many features which enable fine grained security and data separation. It is also built on Azure Storage which enables us to take advantage of all of those features and means that ADLS is still a cost effective storage option!This post runs through some of the great features of ADLS and runs through an example of how we build our solutions using this technology!
Speaking at NDC London: Combatting illegal fishing with Machine Learning and Azure
In January 2020, Carmel is speaking about creating high performance geospatial algorithms in C# which can detect suspicious vessel activity, which is used to help alert law enforcement to illegal fishing. The input data is fed from Azure Data Lake Storage Gen 2, and converted into data projections optimised for high-performance computation. This code is then hosted in Azure Functions for cheap, consumption based processing.

Import and export notebooks in Databricks
Sometimes it's necessary to import and export notebooks from a Databricks workspace. This might be because you have some generic notebooks that can be useful across numerous workspaces, or it could be that you're having to delete your current workspace for some reason and therefore need to transfer content over to a new workspace. Importing and exporting can be doing either manually or programmatically. In this blog, we outline a way to recursively export/import a directory and its files from/to a Databricks workspace.

Demystifying machine learning using neural networks
Machine learning often seems like a black box. This post walks through what's actually happening under the covers, in an attempt to de-mystify the process!Neural networks are built up of neurons. In a shallow neural network we have an input layer, a "hidden" layer of neurons, and an output layer. For deep learning, there is simply more hidden layers which allows for combining neuron's inputs and outputs to build up a more detailed picture.If you have an interest in Machine Learning and what is really happening, definitely give this a read (WARNING: Some algebra ahead...)!
How to create a Power BI workspace in an Azure DevOps Pipeline using Powershell
A Power BI based solution typically consists of a variety of technologies - for example Azure data platform services containing source data. As such, automation of Power BI resources needs to be considered as part of a wider DevOps strategy. This post describes the specific steps needed in order to fully automate the creation and security of Power BI workspaces using Powershell and Azure DevOps pipelines.
Using Databricks Notebooks to run an ETL process
Here at endjin we've done a lot of work around data analysis and ETL. As part of this we have done some work with Databricks Notebooks on Microsoft Azure. Notebooks can be used for complex and powerful data analysis using Spark. Spark is a "unified analytics engine for big data and machine learning". It allows you to run data analysis workloads, and can be accessed via many APIs. This means that you can build up data processes and models using a language you feel comfortable with. They can also be run as an activity in a ADF pipeline, and combined with Mapping Data Flows to build up a complex ETL process which can be run via ADF.

Endjin is a Snowflake Partner
Snowflake is a cloud native data warehouse platform, that enabled data engineering, data science, data lakes, data sharing and data warehousing. Endjin are very excited to announce our partnership.

Exploring Azure Data Factory - Mapping Data Flows
Mapping Data Flows are a relatively new feature of ADF. They allow you to visually build up complex data transformation sequences. This can aid in the streamlining of data manipulation and ETL processes, without the need to write any code! This post gives a brief introduction to the technology, and what this could enable!
Snowflake Connector for Azure Data Factory - Part 1

Announcing Power BI Weekly!
Power BI has become more successful than anyone anticipated. We've decided to spin out the Power BI category from the Azure Weekly Newsletter into it's own publication - Power BI Weekly.

A conversation about .NET, The Cloud, Data & AI, teaching software engineers and joining endjin with Ian Griffiths
When he joined endjin, Technical Fellow Ian sat down with founder Howard for a Q&A session. This was originally published on LinkedIn in 5 parts, but is republished here, in full. Ian talks about his path into computing, some highlights of his career, the evolution of the .NET ecosystem, AI, and the software engineering life.

Thoughts about .NET, The Cloud, AI, ML, and teaching software engineers
Ian Griffiths recently joined endjin as a Technical Fellow. We had a long fireside chat, which has been broken down into a 5 part series covering .NET, the Cloud, AI, ML, teaching software engineering, and why he joined endjin.

Branches, builds and modern data pipelines. Let's catch-up!
As an apprentice engineer at endjin, you cover a lot of ground, especially at a consultancy which works with the latest and greatest tools to solve its clients' problems. Learn about endjin's Modern Data Platform, which is a culmination of IP, processes and knowledge built from years of implementing high-performance data-driven solutions. Also learn about the types of tools an apprentice gets to use, and the types of things an apprentice learns along the way.

Using CALENDAR vs CALENDARAUTO to generate 'Date' table for year-on-year comparisons
Are you performing time-intelligence calculations in your Power BI report? Are you using either the CALENDAR or CALENDARAUTO DAX function to create your date table? Care needs to be taken when choosing the generation method for your date table when performing time-based comparisons. This is where it becomes important to understand the implications of generating a date table using the CALENDAR function and CALENDARAUTO function in Power BI. This blog will outline the considerations you need to make whilst designing the measures in your report.

Using Python inside SQL Server
Do you have a bunch of data in SQL Server that you're using ODBC/JDBC to pull data to work with in Python? Using SQL Server's Python integration, you can connect to a SQL Server instance within your preferred IDE and perform the computations on the SQL Server Machine. No more clunky data transferring. Operationalizing a Python model/script is as easy as calling a stored procedure. Any application that can speak to SQL Server can invoke the Python code and retrieve the results. Easy! This blog will provide a few, simple examples which make use of this capability to carry out some simple Python commands, so you can get up and running as quickly as possible.

Snap Back to Reality – Month 2 & 3 of my Apprenticeship
Learn what types of things an apprentice gets up to at endjin a few months after joining. You could be learning about Neural Networks: algorithms which mimic the way biological systems process information. You could be attending Microsoft's Future Decoded conference, learning about Bots, CosmosDB, IoT and much more. Hopefully, you wouldn't be in hospital after a ruptured appendix!

How we set up daily Azure spending alerts and saved $10k
Read how we set up Azure spending alerts and saved over $10k

My first month as an apprentice at endjin
Structured apprenticeships provide a great way to build skills whilst getting real-life experience. Endjin's apprenticeship scheme has been refined over years, with an optimal mixture of training, project work, and exposure to commercial processes - a scheme which is designed to build strong foundations for a well-rounded Software Engineering consultant. This post explains the transition from university to an apprenticeship at endjin, including the types of work an apprentice could end up doing, and some examples of real-life learnings from a real-life apprentice.

Creating a PowerBI report with DirectQuery and multiple SQL Database sources using Elastic Query
Sometimes you want to build a Power BI dashboard that pulls in data from two different data sources. In this blog post Alice Waddicor demonstrates how you can use DirectQuery and multiple databased via ElasticQuery.

Welcome to an internship at endjin!
A career in software engineering doesn't need to start with a Computer Science degree. The underlying traits of problem solving, a willingness to learn and the ability to collaborate well can be built in any field. Internships provide a great way to get your foot-in-the-door in the professional world, and arm you with some real-life experience for future endeavours. This post describes an internship at endjin, including the type of work you could be asked to do and what you could learn.

AWS vs Azure vs Google Cloud Platform - Mobile Services

AWS vs Azure vs Google Cloud Platform - Internet of Things
AWS vs Azure vs Google Cloud Platform - Analytics & Big Data

AWS vs Azure vs Google Cloud Platform - Database
Querying the Azure DevOps Work Items API directly from Power BI
Azure DevOps Work Items offer a lot of power and features out of the box, but sometimes you need insights that Azure DevOps doesn't natively provide. In this blog post Director of Engineering, James Broome, shows how you can use the Azure DevOps Restful API to generate insights and even use Power BI to visualise them in this step-by-step guide.

Automating R Unit Tests With Azure DevOps
Many organisations are starting to adopt the R Programming Language for their data science and financial modelling scenarios. But just because the language is being used for modelling, doesn't mean you should write unit tests that can be exercised as part of your CI/CD pipeline. In this blog post Jess Panni demonstrates how you can run R unit tests inside Azure DevOps.
TeamCity MetaRunner for creating Release Annotations in Azure Application Insights
Meta-Runners allow you to easily create reusable build components for TeamCity, in this post I demonstrate how to create a Meta-Runner to create Azure Application Insights Release Annotations.

Automated R Deployments in Azure

Machine Learning - the process is the science
What do machine learning and data science actually mean? This post digs into the detail behind the endjin approach to structured experimentation, arguing that the "science" is really all about following the process, allowing you to iterate to insights quickly when there are no guarantees of success.

Embracing Disruption - Financial Services and the Microsoft Cloud
We have produced an insightful booklet called "Embracing Disruption - Financial Services and the Microsoft Cloud" which examines the challenges and opportunities for the Financial Service Industry in the UK, through the lens of Microsoft Azure, Security, Privacy & Data Sovereignty, Data Ingestion, Transformation & Enrichment, Big Compute, Big Data, Insights & Visualisation, Infrastructure, Ops & Support, and the API Economy.

Machine Learning - mad science or a pragmatic process?
This post looks at what machine learning really is (and isn't), dispelling some of the myths and hype that have emerged as the interest in data science, predictive analytics and machine learning has grown. Without any hard guarantees of success, it argues that machine learning as a discipline is simply trial and error at scale – proving or disproving statistical scenarios through structured experimentation.
